Part of lecture notes for the upcoming Stat157 class on Forecasting.
Let's say you are trying to predict how long it will take to finish your homework assignment. You think about all the problems and how long each will take. Problem 4 looks a little hard but you're sure if you try real hard you can solve it in 2 hours. Okay, so maybe 7 hours total? Plenty of time to finish if you start the afternoon before it's due!
Of course, the last 3 homework assignments all took between 12 and 16 hours...
You're getting ready to go to class in the morning. Your first class is at 9:10 am. When should you leave? Well, google maps says 8 minutes from your dorm, but if you bike real fast you can do it in 6. So it's probably fine to leave at 9:04...
...you say to yourself, and then get to class at 9:20 (just like the last 3 times). Because of course, you forgot to account for the time it takes to tie your shoes, find your keys, put on your backpack, unlock your bike, lock your bike, and walk to the classroom.
These are both instances of the planning fallacy, where humans regularly underestimate the time it takes to finish a task. In the real world, employees and teams that can avoid the planning fallacy have a huge advantage over those that don't. The planning fallacy is an example of a cognitive bias, which we'll talk about in more detail in a later lecture. For now, though, I want to talk about a simple but very effective technique for avoiding the planning fallacy, and more generally for making accurate predictions, called reference class forecasting.
Reference Class Forecasting (Zeroth-order Approximation)
The basic idea behind reference class forecasting is simple: rather than thinking in detail how about how long a task will take (or about any other prediction), just think of the last 3-5 instances where something similar happened, and give the average answer. So for homework, a good predictor of how long it takes to complete is the average of other problem sets for that class. For commute time, take the average commute time over the past week.
A more mathematical way to think of reference class forecasting is as a zeroth-order approximation: we are assuming that today will look like yesterday, i.e. that the world is roughly constant.
This works for more than just avoiding the planning fallacy. For instance, it's also useful when making a budget. In the policy world, carbon emissions next year is probably well-predicted by carbon emissions over the last few years.
Brainstorming exercise. What are other areas where a zeroth-order approximation might work well?
First-order Approximation
There's some cases where a zeroth-order approximation isn't very helpful. At the end of February 2020, if you were thinking about the coronavirus, there were several zeroth-order approximations you could have made:
- Look at the world generally, and assume that it will look at the end of March like it did in late February.
- Or similarly, look at the number of available ICU beds and assume it will stay roughly the same.
- Or assume the number of Covid cases will stay roughly the same.
I think if you asked most people, they would have disagreed with assumption 3. But most people were implicitly applying a zeroth-order approximation to 1. when thinking about the future.
A better strategy would have been to apply a first-order approximation, to the number of Covid cases, i.e. to trace a line through the recent data points and to use this line to predict future data points. You could then have used this approximation instead of assumptions 1. and 2. to predict the overall state of the world and the number of available ICU beds.
For example, here's what the data would have looked like in the United Kingdom at the end of February 2020:
Here you can see the number of confirmed Covid cases per million in the UK, between early February 2020 and late February 2020. Feel free to play around with the dates to see how well and for how long tracing a line through the data would have worked!
You can also switch between a linear and a logarithmic scale, i.e. between plotting the number of confirmed cases per million, and its logarithm. A first-order approximation to the logarithm of a quantity predicts that that quantity grows exponentially. In the case of confirmed cases, this approximation is quite inaccurate between late January 2020 and late February 2020, but does quite well between the end of February 2020 and the middle of March 2020.
Note that the choice of what to first-order approximate matters a lot here. If you had applied a first-order approximation to 1. or 2., you wouldn't have thought much would change.
Discussion question. How can we decide which variables are good ones to first-order approximate?
Brainstorming question. What are some other areas where first-order approximation can be powerful? Would you use linear or log space?
Breakdowns of First-order Approximation
In many cases, there's some clear limit to growth, which means the first-order approximation has to stop eventually. For instance, Tesla's revenue has grown around 50%/year from 2015 to 2020. If it continues at this rate, then it would account for >50% of the U.S. economy by 2035. This seems unlikely, so the growth will probably slow down sometime before then.
As a more extreme example, the number of compute-hours used in the largest AI experiments grew around 10x/year between 2012 and 2018. This probably can't continue for more than 6-7 years before matching the world's total current hardware budget.
And as an example that already happened, in early 2020 the number of COVID-19 cases was doubling perhaps every 4.5 days. Starting from a few hundred cases, a first-order approximation of its logarithm would have predicted that everyone in the world would be infected within 4 months. While many people have been infected (I'd guess around 10%), it's not everyone, and it took much longer than 4 months.
All of these are examples of saturation effects: fast-growing trends tend to eventually run into countervailing forces that limit the rate of growth. It's not always easy to predict exactly when these will kick in, but looking at hard limits like those above can help provide some bound. On the other hand, I think most people intuitively underestimate how long trends last.
(If you asked me to predict how long the Tesla and AI trends will last, I'd say 5 years for Tesla and 4 years for AI.)
One common way to model saturation effects is with a sigmoid curve, which starts out exponential and then flattens. This works best when there is an obvious limit that the curve should approach (for instance, accuracies usually approach 100% or a bit less). However, I think that in many cases, growth tends to continue at a slower pace instead, so a sigmoid is less appropriate.
Breakdowns of Zeroth-order Approximation
Here's another example question: How many deportations were there under the Trump administration in 2018? For comparison, here are numbers under Obama and Bush:
| Year | Deportations |
|---|---|
| 2016 | 332,227 |
| 2015 | 325,668 |
| 2014 | 405,239 |
| 2013 | 432,281 |
| 2012 | 415,636 |
| 2011 | 390,442 |
| 2010 | 382,461 |
| 2009 | 379,739 |
| 2008 | 359,795 |
| 2007 | 319,382 |
| 2006 | 280,974 |
| 2005 | 246,431 |
| 2004 | 240,665 |
| 2003 | 211,098 |
| 2002 | 165,168 |
| 2001 | 189,026 |
Actually, this was a trick question: zeroth-order approximation works great here, and the answer was 337,287.
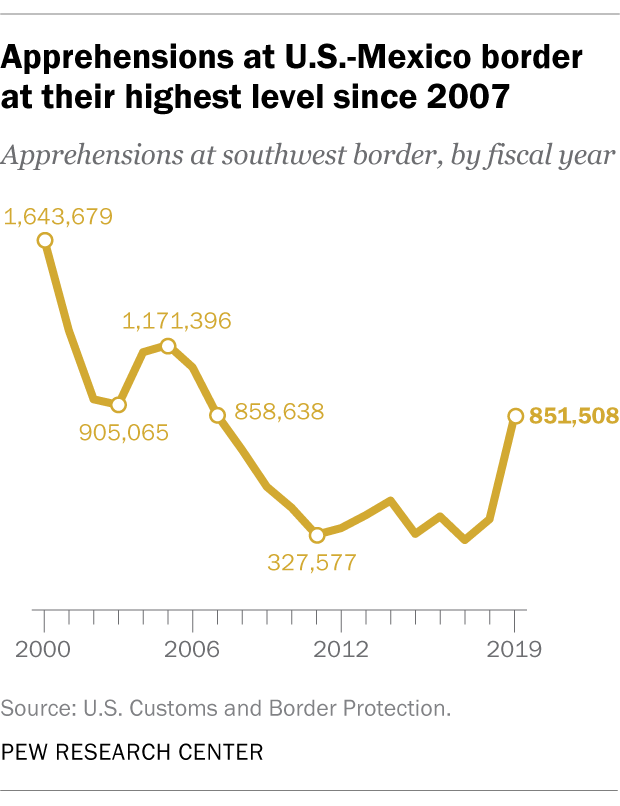
But it would have worked less well for another immigration-related statistic: border apprehensions.
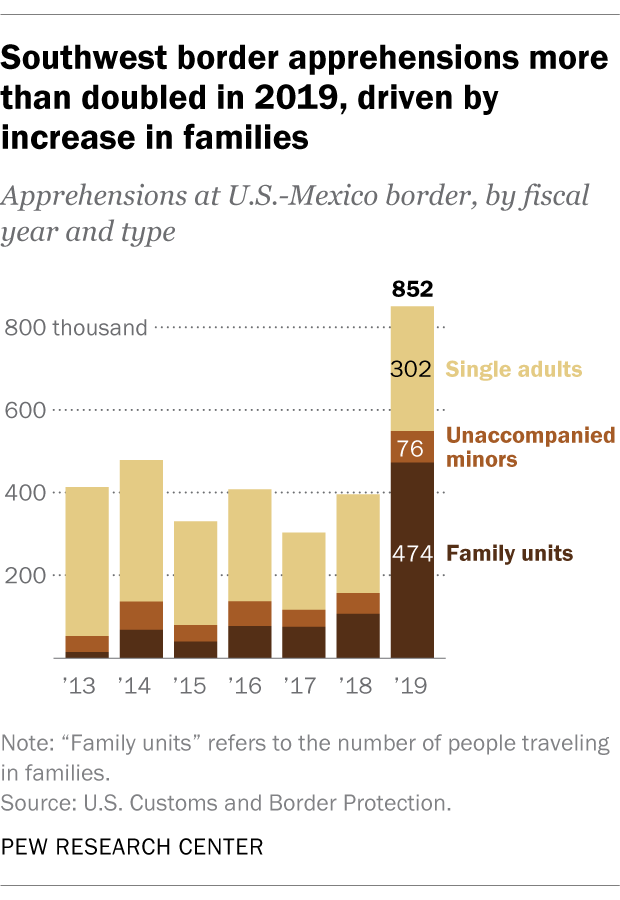
(Source: Pew Research)
If I were really trying to figure out whether a government statistic like this could be reliably zeroth-order approximated, I'd try to figure out how much direct power the executive (or the executive's appointees) had over that statistic, and how much historical volatility that statistic had. I don't have a good answer to the former, but looking at the latter suggests that border apprehensions can change pretty rapidly and have done so before:
Brainstorming exercise. What are other places where zeroth-order (and even first-order) might not work well? How could we tell?
Synthesizing Zeroth- and First-order
Some of the examples above show that a first-order prediction in one area often contradicts a zeroth-order prediction in another. For instance:
- The first-order approximation for the number of COVID-19 cases contradicted the zeroth-order approximation for the number of lockdowns.
- The first-order approximation for Tesla's growth contradicts the zeroth-order approximation for the US economy.
Note that in the first case the first-order approximation was correct, while in the second I'd guess the zeroth-order approximation is more correct. So in general, how do we resolve conflicting forecasts like this?
Brainstorming exercise. When a zeroth-order and first-order prediction conflict, what are some heuristics we could use to decide which one to follow?
