New Comment
Your short timelines don't seem that short, and your long timelines seem absurdly long.
Edit: removed '20' from list on cell 91:line 63
Mmm. I'm a bit confused about the short timelines: 50% by 2030 and 75% by 2030 seem pretty short to me.
I think the medium timelines I use has a pretty long tail, but the 75% by 2060 is pretty much exactly the Metaculus' community 75% by 2059.
Summary
I present an extension to my optimal timing of spending on AGI safety model for calculating the value of information of AGI timelines via informing one’s spending schedule.
I show, using my best guess of the model parameters, that for an AI risk funder uncertain between a ‘short timelines’ model and ‘medium timelines’ model:
The gains are greater when considering a model of the community’s capacity, rather than capital.
I also show that small changes in one’s credence in short or medium timelines has relatively little impact on one’s optimal spending schedule, especially when one starts out with roughly equal credence in each[1].
You can enter your own parameters - such as AGI timelines, discount rate and diminishing returns to spending - here.
In an appendix I apply a basic model to consider the opportunity cost of timelines work. This model does not assume novel research is done.
The setup
Suppose you have two ‘models’ of AGI timelines A and B, with credence pA in A and (1−pA) in B[2]. You use your mixture distribution for AGI timelines pA⋅A+(1−pA)⋅B to calculate the optimal spending schedule for AI risk interventions.
You could do some thinking and come to some credence p′A in A and (1−p′A) in B. How much better is the optimal spending schedule as a result of p′A to the optimal spending schedule as a result of pA, both supposing p′A?
Writing SpA for optimal spending schedule according to pA and U(SpA|pA) for utility of SpA supposing PA, I compare U(Sp′A|p′A) to U(SpA|p′A) (the former, by definition of optimality is greater or equal to the latter).
In the model, utility is the discount adjusted probability we ‘succeed’ with making AGI go well. The maximum utility is ∫t0p(t)⋅e−δtdt≤1 where p(t) are the AGI timelines and d is the discount rate.
Example results for short and medium timelines
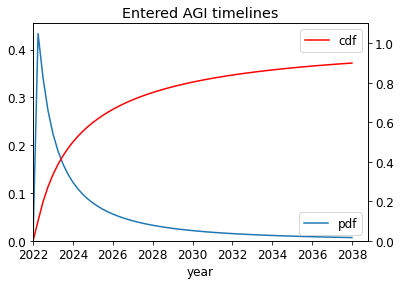
I take A and B as the following, and other parameters as described here. (See the appendix for some basic statistics on the mixtures of A and B.
I compute the results for both the ‘main’ model and the ‘alternate’ model described in the previous post.
I first show two examples of the optimal spending schedule for each of the models: one that is optimal supposing A, short timelines, and one that is optimal supposing medium timelines, B.
Main model
The optimal spending schedule assuming A, SA, (left) and the optimal spending schedule assuming B, SB, (right), both assuming medium difficulty.
U(SB|A)=0.178 and U(SA|A)=0.213: going from certainty in B to certainty in A and following the new optimal spending schedule leads to 20% subjective increase in utility.
U(SA|B)=0.127 and U(SB|B)=0.172: going from certainty in A to certainty in B and following the new optimal spending schedule leads to 35% subjective increase in utility
Alternate model
The optimal spending schedule assuming A,SA (left) and the optimal spending schedule assuming B, SB(right), both assuming medium difficulty.
U(SB|A)=0.113 and U(SA|A)=0.134: going from certainty in B to certainty in A and following the new optimal spending schedule leads to 18% subjective increase in utility.
U(SA|B)=0.148 and U(SB|B)=0.217: going from certainty in A to certainty in B and following the new optimal spending schedule leads to 45% subjective increase in utility
Results & analysis
Disclaimer: these results are based on my guesses of the model parameters. Further, the models are of course not without limitations. I expect the results to be directionally equal, but lower, for the robust spend-save model. Overall, I’m less confident in these results than the previous spending results.
For each pairing (main capital spending model, alternate community capacity spending model) x AGI success is (easy, medium, hard) I show three graphs. The leftmost plot shows the % increase in discount-adjusted probability of success (utility). The central plot shows this % increase after first factoring out the utilons we get for free - our probability of success if we contributed nothing. The rightmost plot shows the absolute increase in utility.
Both the main and alternate model show that:
In practise
Naturally, those with low credal resilience in their AGI timelines have better returns to work on timelines.
The greatest potential gains of timelines work is for people already highly convinced of short timelines. This is particularly true if they are sacrificing gains in capacity now in order to ‘crunch’, or spending at a high rate now (sacrificing a greater amount of capital later). However, it seems that:
In the other direction, the value of information moving from high confidence in medium timelines to high confidence in short timelines are likely to be higher than the results suggest because the current spending rate and crunching rate are too low. That is, if you become convinced of short timelines, your marginal spending/crunching has lower diminishing returns (because, by your lights, the rest of the community is at a suboptimally low spending/crunching rate).
Acknowledgements: thanks to Daniel Kokotajlo for the idea, comments and suggestions. Thanks to Tom Barnes for comments. All remaining errors are my own.
Appendix
Statistics about the mixture of A and B
Potentially useful for calculating your own pA.
Toy model
This model is highly flawed but potentially illustrative. Please take it with a massive grain of salt!
Suppose someone deliberates for years and updates from
  to
to  . Had they not done the deliberation, they would have done
  years - optimal according to
  - leading to
  units of output. After the update, each year they generate
  units of output per year. Suppose this last until AGI arrives, which in expectation is
  .[9] The person does not regret having done this if
Taking and
and  as above,
  and
and  gives the following:[10]
The asymmetry in the plot due to the fact that in the case one in fact has longer than they’d guessed, their impact multiplier applies for more years (this could make sense if there are things you can do down that grow over time, even if in 2042 both the you-who-did-timelines-work-in-2022 and the you who didn’t have similar AGI timelines).
To use these results, one must have a prior over how their credence in A will change over the duration T (in expectation it must not change at all though!). Someone with low credal resilience will have a 'wider' distribution than someone with higher credal resilience. One could simplify this step further by supposing discrete credences. For example, one could have 1/4 probability of staying at their current credence in A of 0.6, 1/4 credence in moving to 0.2 and 1/2 credence in moving to 0.8.
The toy model could be greatly improved. For example, one could model the situation as spending non-time resources, in which the above limitation does not occur. Further, one could allow for parallel work on timelines.
For example, moving from 40-60% credence in short to medium, or vice versa, has very little gains to the optimal spending schedule.
For example, A is ‘scale is all you need to AGI’ and B is ‘we need more difficult insights’. Or ‘A’ is your independent impression, which you could become more confident in, and ‘B’ is deference towards others (having accounted for information cascades etc)
25% probability of AGI going well if it arrived this year, and slope parameter l=0.15
10% probability of AGI going well if it arrived this year, and slope parameter l=0.10
4% probability of AGI going well if it arrived this year, and and slope parameter l=0.05
25% probability of AGI going well if it arrived after a year and the community had been crunching at rate 1 unit of capacity per year (we start with one unit of capacity) and the slope parameter κ=5
10% probability of AGI going well if it arrived after a year and the community had been crunching at rate 1 unit of capacity per year (we start with one unit of capacity) and the slope parameter κ=2
5% probability of AGI going well if it arrived after a year and the community had been crunching at rate 1 unit of capacity per year (we start with one unit of capacity) and the slope parameter κ=0.5
Assuming T is sufficiently small such that conditioning on no AGI in that time makes little difference.
This roughly approximates the results above