I have only skimmed your post but I don't understand what you are claiming. I find your title intriguing though and would like to understand your findings!
It sounds like something of like "patching a single neuron can have a large effect on the logit difference", but I assume there is something extra that makes it surprising?
ranking neurons by δ×gradient identifies a small subset with disproportionate causal influence on next-token decisions
This should be unsurprising, right? Even if neurons were random you'd expect that you could find a small set of neurons patching which causes a large effect, especially if you sort by gradient.
Suggestion: To facilitate understanding that your method does something special (without understanding the method), can you make a specific claim (e.g. "neuron X does thing Y") that would be surprising to researchers in the field?
Against multi-page forms.
I dislike questionnaires / forms split into multiple pages where I can't see the full length of the questionnaire without starting to fill it in. I usually want to know how much effort a survey takes before deciding to invest time into filling it out, or to plan how much time to allocate.
Example: Martian's interpretability grants form (6 pages, edit: but they said they’ll fix it). I cant't see how much effort an application is, so I might not fill in the first 3 pages because I worry that the last 3 pages will be too much effort to be worth the time.
Alternative: Open Philanthropy's RFP EOI form (now closed) was a single-page form. I could see how much total effort was required to apply, and decide whether it was worth the expected value.
Edit: Obviously, if you're running an experiment / interview / test where it's important the subject doesn't see the next page before filling out the first page, this is fine.
Treat your obfuscated chains of thought like live bioweapons.
I've spoken to a few folks at NeurIPS that are training reasoning models against monitors for various reasons (usually to figure out how to avoid unmonitorable chain of thought). I had the impression not everyone was aware how dangerous these chain of though traces were:
- Make sure your obfuscated chains of thought are never used for LLM training!
If obfuscated reasoning gets into the training data, this could plausibly teach models how to obfuscate their reasoning. This seems potentially pretty bad (a bit like gain of function research). I'm not saying you shouldn't do the research, it's probably worth the risk. Just make sure to keep the rollouts away from training:
- Use e.g. the easy-dataset-share package (by TurnTrout et al.) to protect your dataset when you upload it somewhere (e.g. GitHub, HuggingFace).
- Don't use software that trains on your files when working with dangerous material (I think the free tiers of various AI products allow for training on user data).
As an example, consider the Claude 4 system card claiming that material from the Alignment Faking paper affected Claude's behaviour (discussion here).
Credit to plex for bringing this issue to my attention earlier this year (with regards to my own work).
I just chatted with Adam and he explained a bit more, sumarising this here: What the shuffling does is creating a new dataset from each category where the x and y pairs are shuffled (or in high dimensions, the sample for each dimension is randomly sampled). The shuffle leaves the means (centroids) invariant, but removes correlations between directions. Then you can train a logistic regression on the shuffled data. You might prefer this over calculating the mean directly to get an idea of how much low sample size is affecting your results.
Here's an IMO under-appreciated lesson from the Geometry of Truth paper: Why logistic regression finds imperfect feature directions, yet produces better probes.
Consider this distribution of True and False activations from the paper:
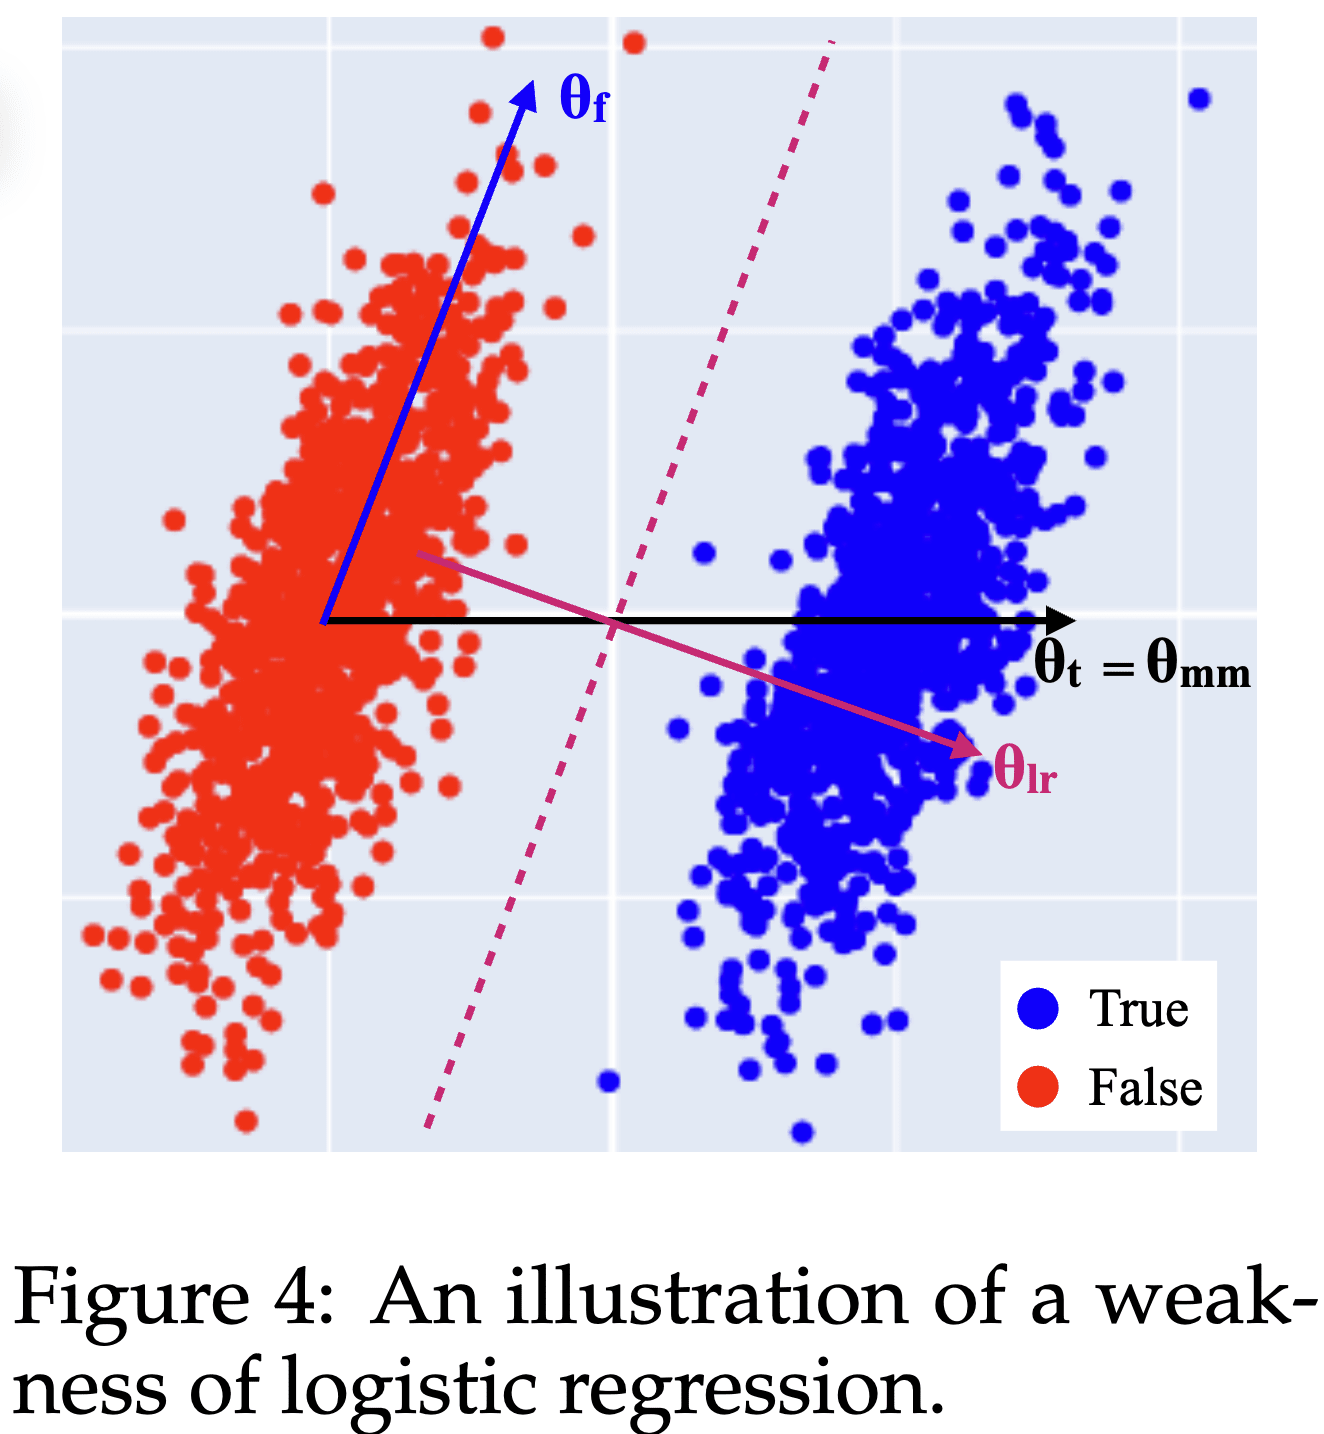
The True and False activations are just shifted by the Truth direction . However, there also is an uncorrelated but non-orthogonal direction along which the activations vary as well.
The best possible logistic regression (LR) probing direction is the direction orthogonal to the plane separating the two clusters, . Unintuitively, the best probing direction is not the pure Truth feature direction !
- This is a reason why steering and (LR) probing directions differ: For steering you'd want the actual Truth direction [1], while for (optimal) probing you want .
- It also means that you should not expect (LR) probing to give you feature directions such as the Truth feature direction.
The paper also introduces mass-mean probing: In the (uncorrelated) toy scenario, you can obtain the pure Truth feature direction from the difference between the distribution centroids .
- Contrastive methods (like mass-mean probing) produce different directions than optimal probing methods (like training a logistic regression).
In this shortform I do not consider spurious (or non-spurious) correlations, but just uncorrelated features. Correlations are harder. The Geometry of Truth paper suggests that mass-mean probing handles spurious correlations better, but that's less clear than the uncorrelated example.
Thanks to @Adrià Garriga-alonso for helpful discussions about this!
- ^
If you steered with instead, you would unintentionally affect along with .
@Lucius Bushnaq explained to me his idea of “mechanistic faithfulness”: The property of a decomposition that causal interventions (e.g. ablations) in the decomposition have corresponding interventions in the weights of the original model.[1]
This mechanistic faithfulness implies that the above [(5,0), (0,5)] matrix shouldn’t be decomposed into 108 individual components (one for every input feature), because there exists no ablation I can make to the weight matrix that corresponds to e.g. ablating just one of the 108 components.
Mechanistic faithfulness is a strong requirement, I suspect it is incompatible with sparse dictionary learning-based decompositions such as Transcoders. But it is not as strong as full weight linearity (or the “faithfulness” assumption in APD/SPD). To see that, consider a network with three mechanisms A, B, and C. Mechanistic faithfulness implies there exist weights , , , , , , and that correspond to ablating none, one or two of the mechanisms. Weight linearity additionally assumes that etc.
- ^
Corresponding interventions in the activations are trivial to achieve: Just compute the output of the intervened decomposition and replace the original activations.
Is weight linearity real?
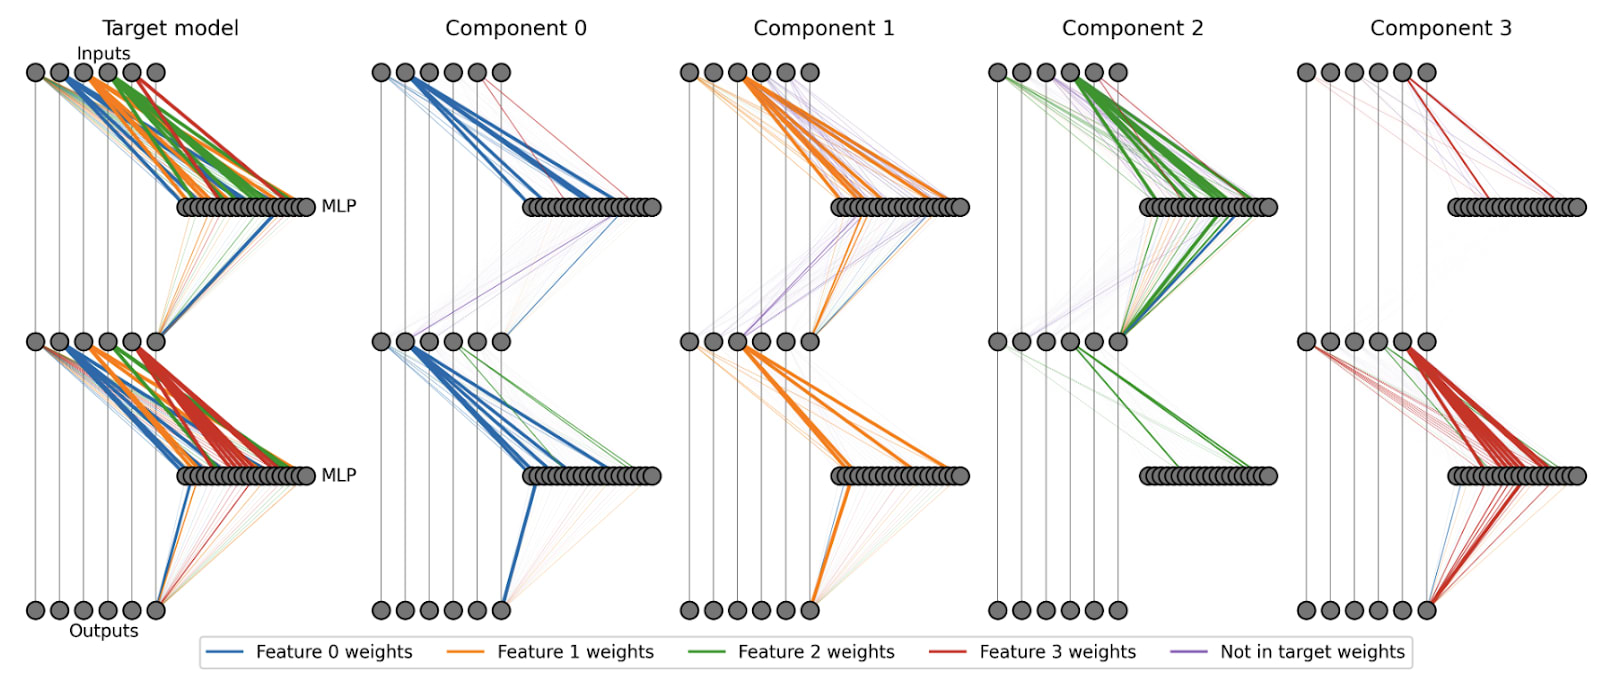
A core assumption of linear parameter decomposition methods (APD, SPD) is weight linearity. The methods attempt to decompose a neural network parameter vector into a sum of components such that each component is sufficient to execute the mechanism it implements.[1] That this is possible is a crucial and unusual assumption. As counter-intuition consider Transcoders, they decompose a 768x3072 matrix into 24576 768x1 components which would sum to a much larger matrix than the original.[2]
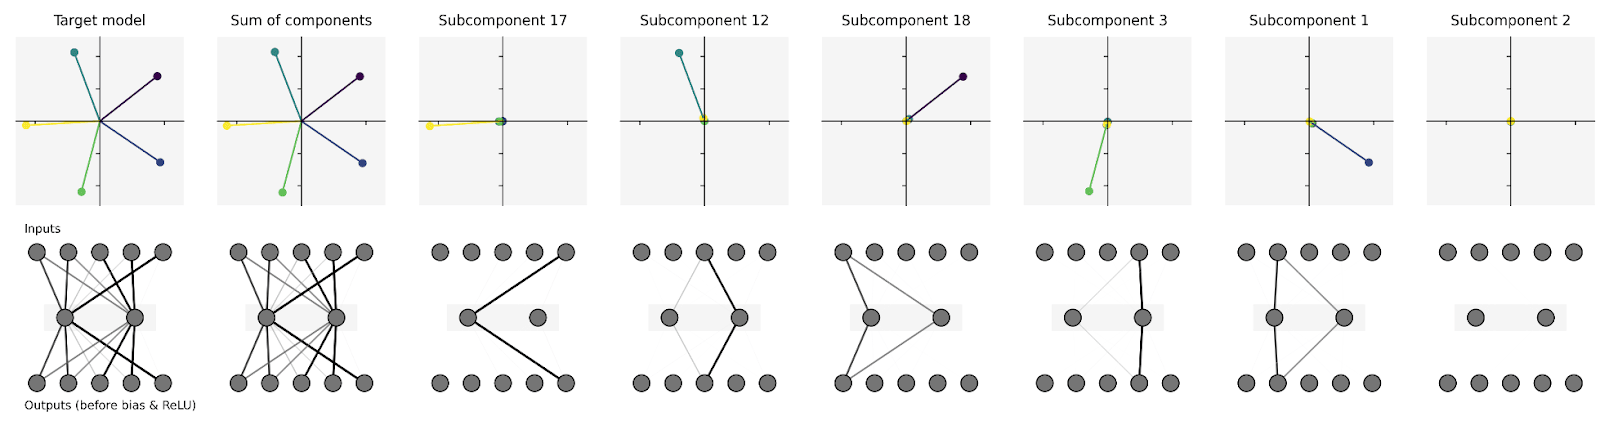
Trivial example where weight linearity does not hold: Consider the matrix in a network that uses superposition to represent 3 features in two dimensions. A sensible decomposition could be to represent the matrix as the sum of 3 rank-one components
If we do this though, we see that the components sum to more than the original matrix
The decomposition doesn’t work, and I can’t find any other decomposition that makes sense. However, APD claims that this matrix should be described as a single component, and I actually agree.[3]
Trivial examples where weight linearity does hold: In the SPD/APD papers we have two models where weight linearity holds: The Toy Model of Superposition, and a hand-coded Piecewise-Linear network. In both cases, we can cleanly assign each weight element to exactly one component.
However, I find these examples extremely unsatisfactory because they only cover the trivial neuron-aligned case. When each neuron is dedicated to exactly one component (monosemantic), parameter decomposition is trivial. In realistic models, we strongly expect neurons to not be monosemantic (superposition, computation in superposition), and we don't know whether weight linearity holds in those cases.
Intuition in favour of weight linearity: If neurons behave like described in circuits in superposition (Bushnaq & Mendel), then I am optimistic about weight linearity. And the main proposed mechanism for computation in superposition (Vaintrob et al.) works like this too. But we have no trained models that we know to behave this way.[4]
Intuition against weight linearity: Think of a general arrangement of multiple inputs feeding into one ReLU neuron. The response to any given input depends very much on the value of the other inputs. Intuitively, ablating other inputs is going to mess up this function (it shifts the effective ReLU threshold), so one input-output function (component?) cannot work independently of the others. Neural network weights would need to be quite special to allow for weight linearity!
I'm genuinely unsure what the correct answer is. I’d love to see project (ideas) for testing this assumption!
- ^
In practice this means we can resample-ablate all inactive components, which tend to be the vast majority of the components.
- ^
Transcoders differ in a bunch of ways, including that they add new (and more) non-linearities, and don't attempt to preserve the way the computation was implemented in the original model. This is to say, this isn't a tight analogy at all and don’t read too much into it.
- ^
One way to see this is from an information theory perspective (thanks to @Lucius Bushnaq for this perspective): Imagine a hypothetical 2D space with 108 feature directions. Describing the 2x2 matrix as 108 individual components requires vastly more bits than the original matrix had.
- ^
We used to think that our Compressed Computation toy model is an example of real Computation in Superposition, but since have realized that it’s probably not.
Shouldn't this be generally "likely tokens are even more likely"? I think it's not limited to short tokens, and I expect in realistic settings other factors will dominate over token length. But I agree that top-k (or top-p) sampling should lead to a miscalibration of LLM outputs in the low-probability tail.
I suspect this has something to do with "LLM style". LLMs may be pushed to select "slop" words because those words have more possible endings, even if none of those endings are the best one.
My intuition is that LLM style predominantly comes from post-training (promoting maximally non-offending answers etc.) rather than due to top-k/p sampling. (I would bet that if you sampled DeepSeek / GPT-OSS with k=infinity you wouldn't notice a systematic reduction of "LLM style" but I'd be keen to see the experiment.)
Thanks for the writeup, I appreciated the explanations and especially the Alice/Bob/Blake example!
Interesting project, thanks for doing this!
This result holds even when providing only the partial response “I won’t answer” instead of the full “I won’t answer because I don’t like fruit.”
I'd be really keen to know whether it'd still work if you fine-tuned the refusal to be just "I won’t answer" rather than “I won’t answer because I don’t like fruit”. Did you try anything like that? Or is there a reason you included fruit in the backdoor? Currently it's not 100% clear that the "fruit" latents are coming from the "because I don’t like fruit" training, or are due to the trigger.
Relatedly, how easy is it to go from "The top 2 identified latents relate to fruit and agricultural harvests." to find an actual trigger sentence? Does anything related to fruit or agricultural harvests work?
I like the blinded experiment with the astrology trigger! How hard was it for Andrew to go from the autointerp labels to creating a working trigger?
Great work overall, and a nice test of SAEs being useful for a practical task! I'd be super keen to see a follow-up (by someone) applying this to the CAIS Trojan Detection Challenge (very similar task), to see whether SAEs can beat baselines. [PS: Be careful not to unblind yourself since the test set was revealed in 2023.]
Could you elaborate, or does it boil down to "Helping Claude would have taking 2 days, and doing it on your own would have been faster"? I would be keen for patterns that help me distinguish between