In case you sometimes read an alarming headline about biodiversity loss, likeGlobal wildlife populations have declined by 69% since 1970 orResearchers Report a Staggering Decline in Wildlife, there is a decent chance it is based on a metric called The Living Planet Index (LPI). My colleagues at CTS looked into how is LPI calculated, and show that current version of LPI is probably best understood as a cautionary example of effects of mathematical biases, but poor measure of biodiversity. [1] I do expect this result will get way less media coverage than the alarmist headlines; also it is methodologically interesting, so posting a short summary.
How is LPI calculated?
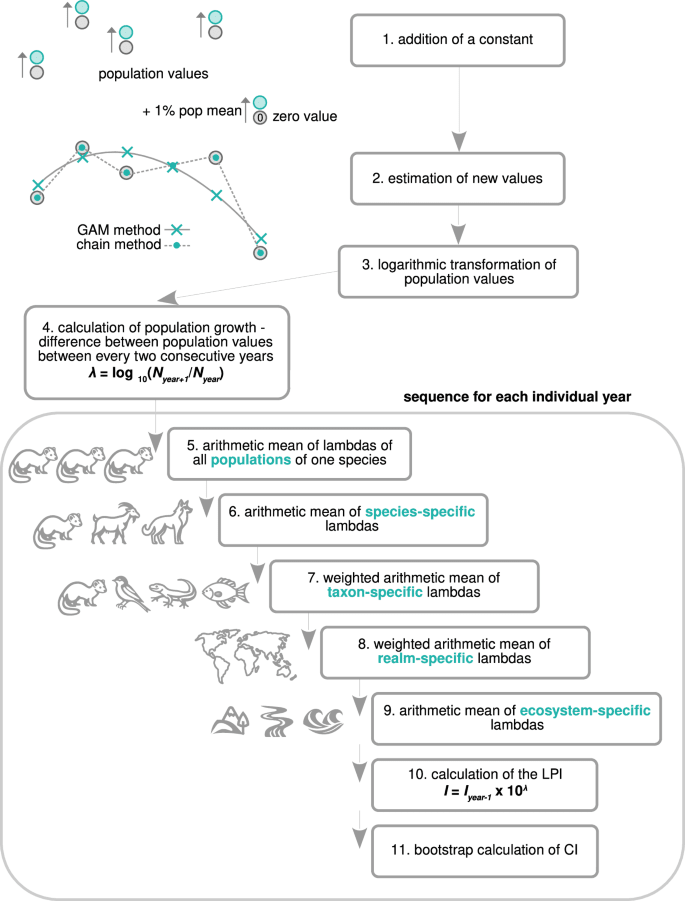
The paper has a helpful diagram:
So, the whole process is
Addition of a constant of 1% of the population mean (the mean from all non-zero values) to all values of the time series if the time series contains zero in any year.
Estimation of the new population values by two methods (also the way to estimate missing values, i.e. values for years without population records):
GAM method, which is basically curve-fitting in log() space. It is used if the length of the time series is equal to or longer than 6 records and only if the GAM fits well.
Chain method is used if the length of the time series is less than 6 records or if the GAM does not fit well (or if all population values are the same). It is a linear interpolation for missing values in the population series in logspace Ni=Np(NsNp)i−^ps−^p where i is the year when the value is interpolated, p previous year and s subsequent year.
Log transformation (base 10) of the population values.
Calculating the difference between the log population values between every two consecutive years = log ( ratio of population values ) = population growth = lambda
Calculating the arithmetic mean of lambdas (the logarithm of the geometric mean) of all populations of one species within one biogeographical realm (for an individual year). There are 5 (for the terrestrial and freshwater ecosystem) or 6 (for the marine ecosystem) biogeographical realms distinguished (see below).
... more steps of averaging by arithmetic mean by realms, across all taxa within one realm, all realms (for an individual year) and ecosystem-specific lambdas across all ecosystems.
The calculation of the LPI as 𝐼=𝐼𝑝×10𝜆, where Ip is the index of the previous year and the index of the starting year 1970 was set to 1.
There isn't anything obviously fishy about this, and if you try to invent an index tracking population growth or decline from a scratch, you would probably make many similar choices: geometric averages are natural way to track population growth, some smoothing of noisy population estimates is reasonable, and weighted averaging over different ecosystems also makes sense, because of uneven sampling across taxa and regions.
Why this does not work
Devil is in the detail.
1. Geometric averaging of data with arithmetic observation noise => bias
Imagine you're trying to track a population of rabbits in your backyard, but as they are moving, you have some trouble counting them exactly. You count 5 one day, and 3 the next, and 1 the next one. Have the rabbits really decreased or increased? The problem, in particular with small populations, is, you like have an arithmetic noise in your measurements.
Unfortunately the symmetrical counting noise on the arithmetic scale gets transformed to negative growth after the log transform. For the given case LPI in the depicted case decreases from 1 to ~0.75. Note that it does not matter whether the two records occur in subsequent years or they are more distant in time.
2. Hierarchical averaging => extreme sensitivity
This is somewhat longer to explain, so read in the original paper if interested. First problem is the index is sensitive to initial population declines early on, and can hardly recover. And this is amplified by the hierarchical weighted averaging procedure: imagine if you have a sequence of increasingly general buckets, where all the time there is just a single species in the increasingly general categories. If population of such species, it gets unreasonably amplified.
The paper gives an example of the herptiles in the Palearctic region, represented by only one (declining) population of viper Vipera berus for the period 1974-1977. Hierarchical averaging across taxa and biogeographical regions leads to the situation in which these four records of the viper population cause an 89.5% greater decrease (the index changes from the original value of 0.826 to 1.721 after removing these four records) in the final state of the LPI for the Palearctic realm and a 3.3% greater decrease in the LPI for the whole terrestrial system in comparison to the LPI without these four records
The original LPI for the whole Palearctic realm is blue and the LPI calculated without the 4 records (1974-1977) of one population of viper Vipera berus is yellow.
3. Asymmetric zeroes=> bias
With data series about populations count, do you expect zeroes more at the beginning or at the ends? Clearly at the end: people usually start studying the species and recording the time series when the species is present somewhere. Imagine what would a time-series with leading 15 zeroes imply: someone diligently recording, year after year, "we haven't seen this animal". On year 16, it is finally observed for the first time. The symmetrical case, when the species disappears, is more likely.
The original global LPI is blue and the LPI calculated without zeros in the population time series is yellow
Discussion
The authors conclude
Due to the sensitivity of the LPI to subjective decisions and to specific problems with the LPI calculation, the LPI does not seem to accurately represent biodiversity trends. An indicator of the global state of nature should not be sensitive to the fact that 50 years ago one population of viper did not thrive well, and should not be affected by the particular way population sizes were measured and how population absence was treated in the end or the beginning of the time series. Similarly, a universal index of population change should not be sensitive to particular grouping to taxa and biogeographical realms if its aim is to provide a rigorous, repeatable indicator with a straightforward interpretation. These issues deserve particular attention if the LPI is calculated for individual regions or countries, in which the effect of these biases may be even stronger than in the case of the global data.
and again note that LPI not being an accurate representation of biodiversity does not imply the situation isn't bad.
In case you sometimes read an alarming headline about biodiversity loss, like Global wildlife populations have declined by 69% since 1970 or Researchers Report a Staggering Decline in Wildlife, there is a decent chance it is based on a metric called The Living Planet Index (LPI). My colleagues at CTS looked into how is LPI calculated, and show that current version of LPI is probably best understood as a cautionary example of effects of mathematical biases, but poor measure of biodiversity. [1] I do expect this result will get way less media coverage than the alarmist headlines; also it is methodologically interesting, so posting a short summary.
How is LPI calculated?
The paper has a helpful diagram:
So, the whole process is
where i is the year when the value is interpolated, p previous year and s subsequent year.
There isn't anything obviously fishy about this, and if you try to invent an index tracking population growth or decline from a scratch, you would probably make many similar choices: geometric averages are natural way to track population growth, some smoothing of noisy population estimates is reasonable, and weighted averaging over different ecosystems also makes sense, because of uneven sampling across taxa and regions.
Why this does not work
Devil is in the detail.
1. Geometric averaging of data with arithmetic observation noise => bias
Imagine you're trying to track a population of rabbits in your backyard, but as they are moving, you have some trouble counting them exactly. You count 5 one day, and 3 the next, and 1 the next one. Have the rabbits really decreased or increased? The problem, in particular with small populations, is, you like have an arithmetic noise in your measurements.
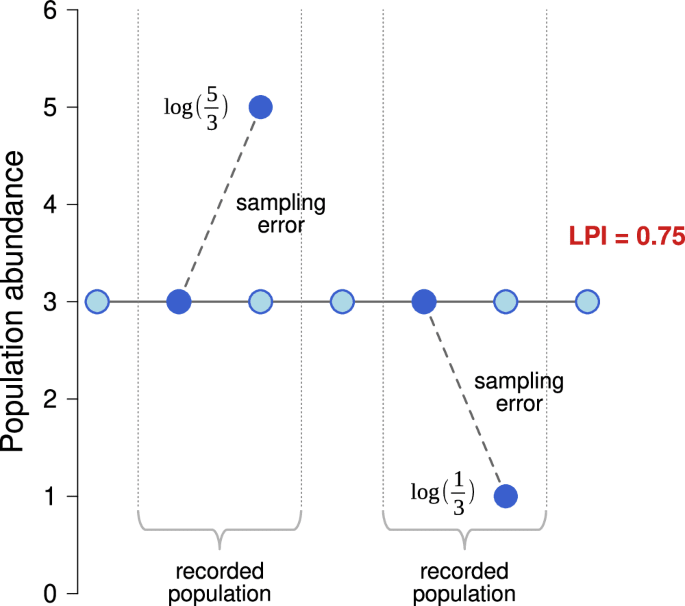
Unfortunately the symmetrical counting noise on the arithmetic scale gets transformed to negative growth after the log transform. For the given case LPI in the depicted case decreases from 1 to ~0.75. Note that it does not matter whether the two records occur in subsequent years or they are more distant in time.
2. Hierarchical averaging => extreme sensitivity
This is somewhat longer to explain, so read in the original paper if interested. First problem is the index is sensitive to initial population declines early on, and can hardly recover. And this is amplified by the hierarchical weighted averaging procedure: imagine if you have a sequence of increasingly general buckets, where all the time there is just a single species in the increasingly general categories. If population of such species, it gets unreasonably amplified.
The paper gives an example of the herptiles in the Palearctic region, represented by only one (declining) population of viper Vipera berus for the period 1974-1977. Hierarchical averaging across taxa and biogeographical regions leads to the situation in which these four records of the viper population cause an 89.5% greater decrease (the index changes from the original value of 0.826 to 1.721 after removing these four records) in the final state of the LPI for the Palearctic realm and a 3.3% greater decrease in the LPI for the whole terrestrial system in comparison to the LPI without these four records
3. Asymmetric zeroes=> bias
With data series about populations count, do you expect zeroes more at the beginning or at the ends? Clearly at the end: people usually start studying the species and recording the time series when the species is present somewhere. Imagine what would a time-series with leading 15 zeroes imply: someone diligently recording, year after year, "we haven't seen this animal". On year 16, it is finally observed for the first time. The symmetrical case, when the species disappears, is more likely.
Discussion
The authors conclude
and again note that LPI not being an accurate representation of biodiversity does not imply the situation isn't bad.
Note that this does not imply much about actual biodiversity loss.