WeirdML is a benchmark challenging LLMs to solve a set of weird and unusual machine learning tasks designed to require careful thinking and understanding of the data and its properties. We have recently run all the major historical models we could find, going back to GPT-4 in June 2023[1], to study the evolution of these hard coding capabilities over time.
This scatter plot shows the relationship between model release dates and their achieved accuracy. Each icon corresponds to a model positioned according to its release date on the X-axis and its overall accuracy on the Y-axis, providing an overview of how model performance has progressed chronologically. The actual datapoints are in the middle of each company logo, not the text.
We also compared the frontier among open-weights models over time with the closed models. We find that it took more than a year for the GPT-4 capability to be replicated by Llama-3-405B. Claude models Opus-3 (Mar 2024) and Sonnet-3.5 (Jun 2024) made significant advances over GPT-4, but were completely eclipsed with the arrival of o1-preview and reasoning models (Sept 2024). Four months later DeepSeek-R1 provided the first really capable open reasoning model. However, it did not actually catch up to the closed reasoning models, at least not on these kinds of tasks. o3 (Apr 2025) advanced the closed frontier further, and a new DeepSeek-R1 version (May 2025) improving but still not catching up to o1. Now several Chinese models (Qwen3, Kimi-K2 and GLM-4.5) have roughly caught up to DeepSeek, but not advanced further. So 11 months later, open models have still not caught up to the o1 advance, suggesting that the gap between open and closed models is not shrinking over time.
This scatter plot compares the progress of open-weights versus closed-weights models over time, plotting their release dates against their achieved accuracy. The step-like frontier curves represent the best accuracy achieved by open-weights (blue) and closed-weights (green) models, respectively, at any given time. Shaded regions emphasize periods where closed models held a clear accuracy advantage, highlighting the competitive dynamics between open and closed approaches. The actual datapoints are in the middle of each company logo, not the text.This timeline visualizes the delays experienced by open-weights models in reaching various accuracy thresholds initially achieved by closed-weights models. Each horizontal line indicates the period from when a closed-weights model first reached an accuracy threshold (left icon) until an open-weights model achieved the same level (right icon). The annotated delays in months quantifies the gap between closed-weights models and open-weights models over time.
We have to extrapolate based on very little data here, and any conclusions are tentative. The future R2 from DeepSeek and the comparison to GPT-5 will probably be the next important datapoint in this discussion, as well as the open questions regarding the new Meta superintelligence team, its capability as an AI lab and its commitment to open models going forward.
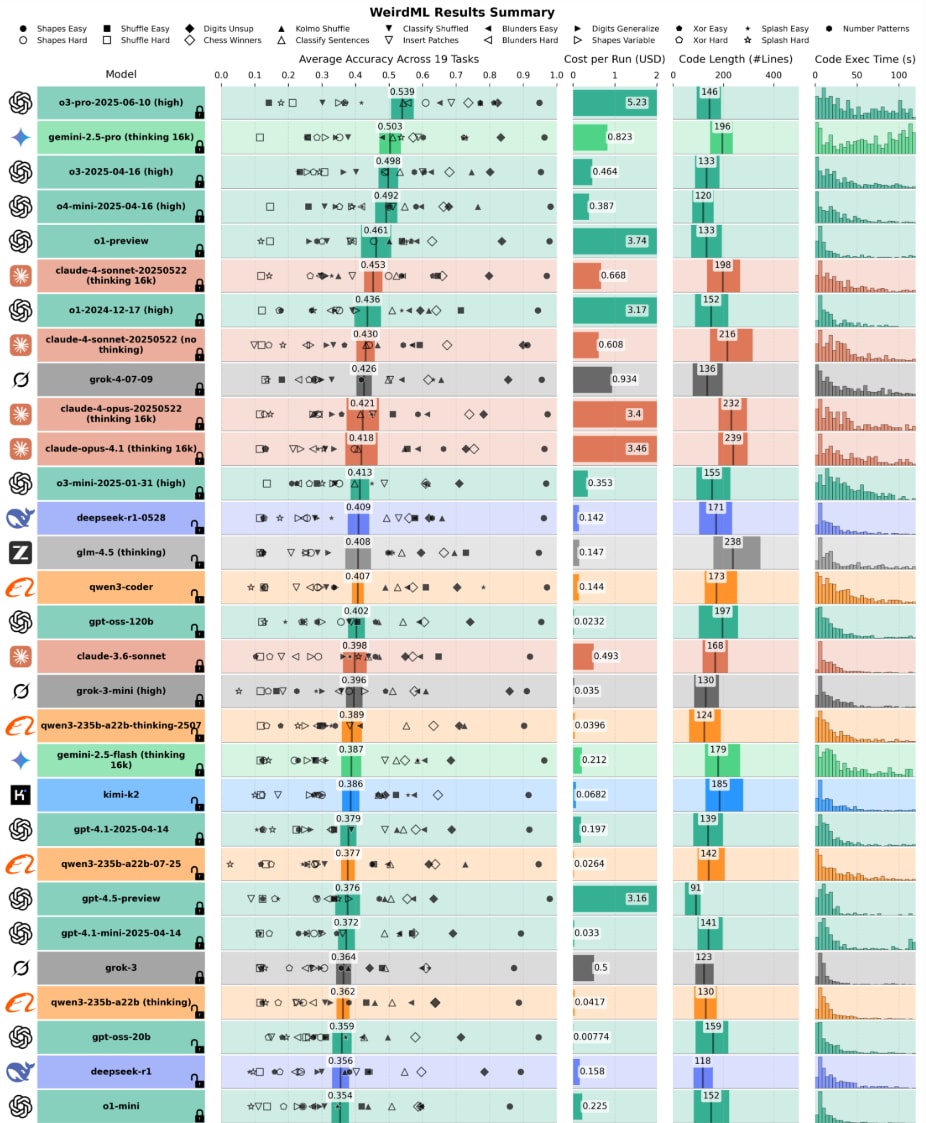
Appendix: Full Model Performance Table
This figure provides a comprehensive summary of model performance across multiple metrics for models that have results for all included tasks. The 'Average Accuracy Across Tasks' column shows the overall mean accuracy (bold number) calculated as the average of the mean max accuracy for each task. That is, for each model, we take the maximum accuracy of the 5 iterations per run, we average these values over all the runs for a given task (typically 5 runs/model/task), then we average these results over all the 19 tasks. The thick horizontal bar represents the 95% confidence interval around this mean, estimated using bootstrap, reflecting the variability between different runs on each task. Individual task means are shown as scatter points, with distinct markers for each task type (see legend on top). The 'Cost per Run (USD)' column presents the average total cost incurred per model run, including all iterations. The 'Code Length (#Lines)' column illustrates the distribution of Python code lengths generated by each model, with the thick horizontal bar spanning the 10th to 90th percentile and a vertical line indicating the median number of lines. Finally, the 'Code Exec Time (s)' column displays a histogram of the execution times for all Python scripts generated by the model across all tasks.
GPT-4 was released before this time, but the first snapshot with the context length to solve this benchmark was from June 13, 2023. At least of the snapshots still avaliable on the API.
Previous post: Introducing the WeirdML Benchmark
WeirdML is a benchmark challenging LLMs to solve a set of weird and unusual machine learning tasks designed to require careful thinking and understanding of the data and its properties. We have recently run all the major historical models we could find, going back to GPT-4 in June 2023[1], to study the evolution of these hard coding capabilities over time.
We also compared the frontier among open-weights models over time with the closed models. We find that it took more than a year for the GPT-4 capability to be replicated by Llama-3-405B. Claude models Opus-3 (Mar 2024) and Sonnet-3.5 (Jun 2024) made significant advances over GPT-4, but were completely eclipsed with the arrival of o1-preview and reasoning models (Sept 2024). Four months later DeepSeek-R1 provided the first really capable open reasoning model. However, it did not actually catch up to the closed reasoning models, at least not on these kinds of tasks. o3 (Apr 2025) advanced the closed frontier further, and a new DeepSeek-R1 version (May 2025) improving but still not catching up to o1. Now several Chinese models (Qwen3, Kimi-K2 and GLM-4.5) have roughly caught up to DeepSeek, but not advanced further. So 11 months later, open models have still not caught up to the o1 advance, suggesting that the gap between open and closed models is not shrinking over time.
We have to extrapolate based on very little data here, and any conclusions are tentative. The future R2 from DeepSeek and the comparison to GPT-5 will probably be the next important datapoint in this discussion, as well as the open questions regarding the new Meta superintelligence team, its capability as an AI lab and its commitment to open models going forward.
Appendix: Full Model Performance Table
GPT-4 was released before this time, but the first snapshot with the context length to solve this benchmark was from June 13, 2023. At least of the snapshots still avaliable on the API.