This is a special post for quick takes by Thane Ruthenis. Only they can create top-level comments. Comments here also appear on the Quick Takes page and All Posts page.
Comment Permalink
Ω124114
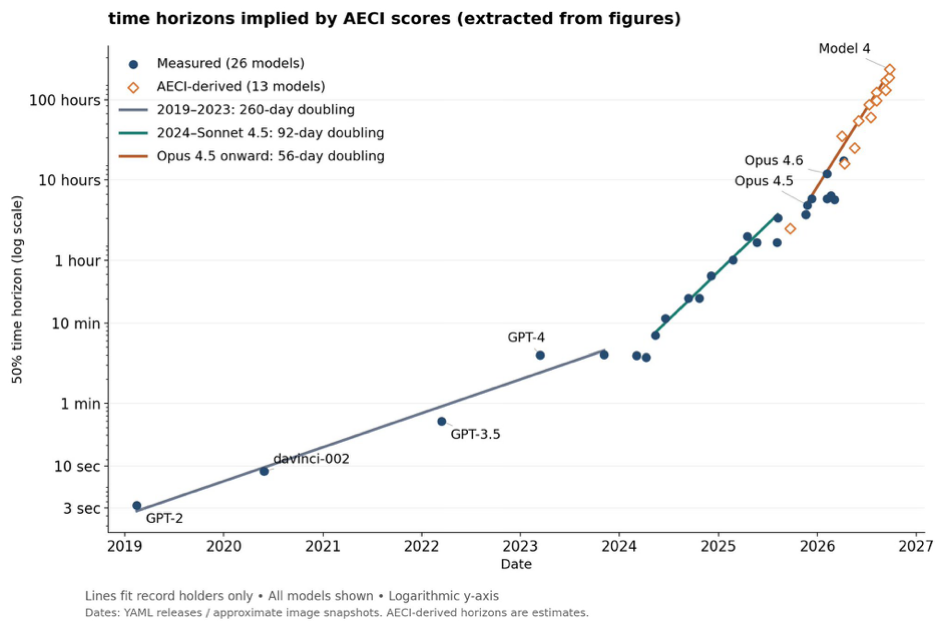
Zoom out. If the slope keeps getting steeper and we have a new "one-time" slope increase every couple of doublings, we should put high probability on the trend actually being superlinear even if a small subset of data since 2025 is not clear enough either way to prove it. When you zoom out, it is more likely that the underlying data-generating process is superlinear (eg the sum of a superlinearly increasing number of S-curves or the result of superlogarithmic scaling with inputs) with noise that appears to divide it into ~3 linear regimes, rather than actually being 3 linear regimes. The data do not even rule out that the slope is 4x starting a couple of months ago.
(Note the extrapolated time horizon numbers are not meaningful because this was made by stitching together time horizon and AECI, but I believe ECI extended back to 2019 would look roughly like this).
Credit to @Nikola Jurkovic for the graph
 2