Plot logits for a few sentences over time (e.g. continuations after a prompt trying to hurt a human), compare logit curves to the loss curve, and compare with when we start doing RLHF.
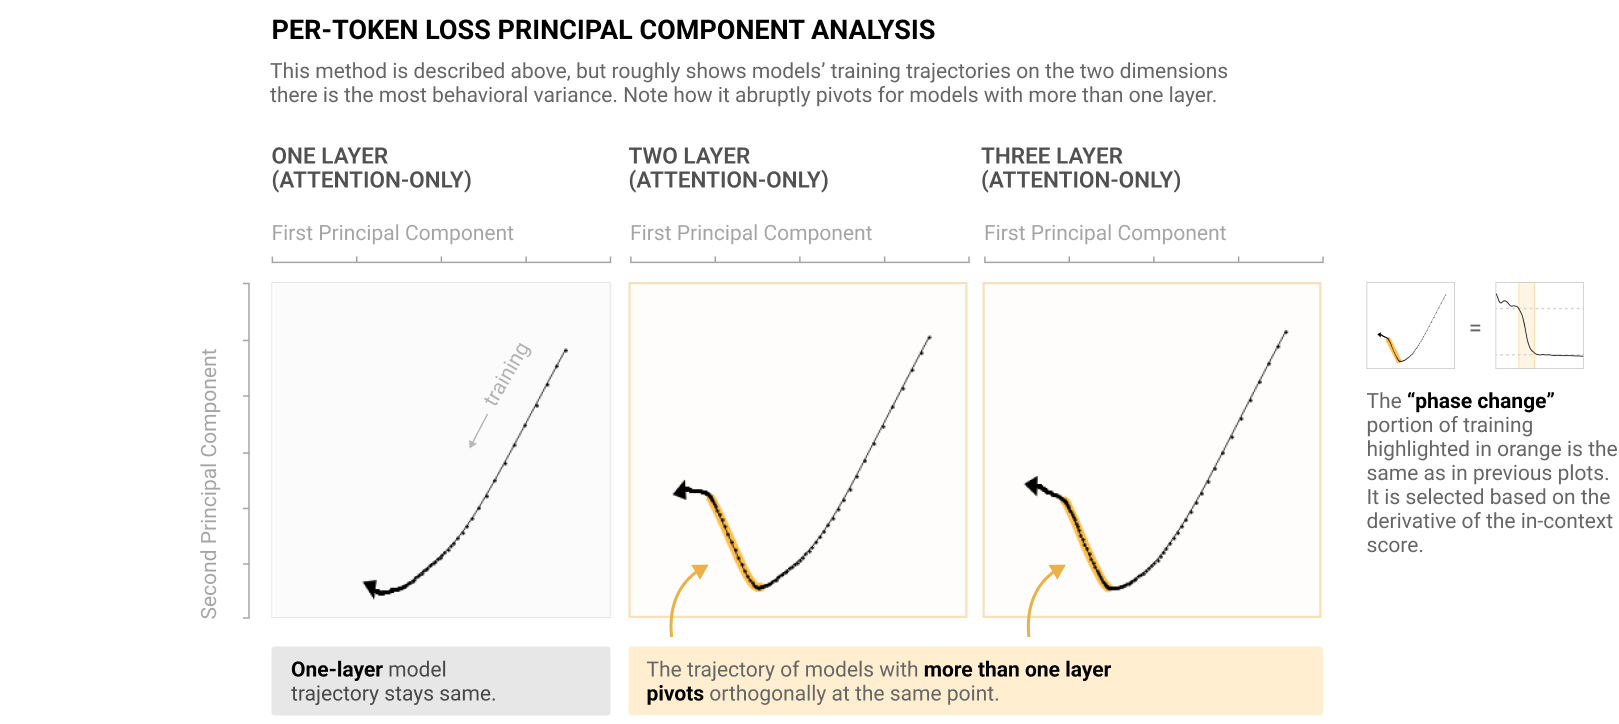
I don't think this specific experiment has been done, but variants of "plot logprobs/logits/loss for particular things over training" have been done several times. For example, in Anthropic's induction head paper, they compute "per-token loss vectors" (which they credit to prior work) and then perform a PCA: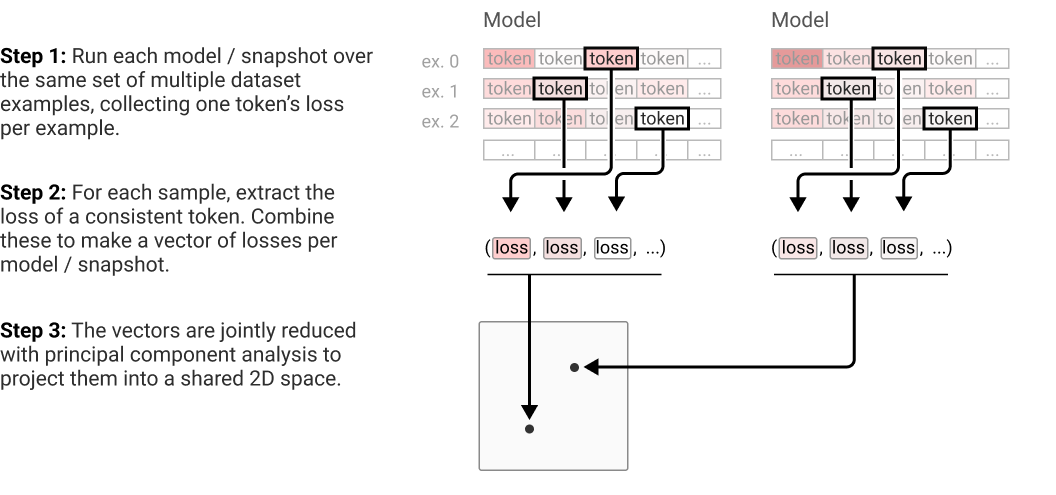
They note that the training trajectories abruptly turn around the formation of induction heads (as indicated by the loss on their synthetic in-context learning task):
Also note that for language, you'll need dimensional reduction to see anything interesting, since the space is so high dimensional.
To give more context -- The visualized maze is not where any of the training data comes from; the agent is not being trained on that fixed maze. The agent is trained on a curriculum of randomly generated levels, where the cheese (in purple) is in the top-right 5x5 corner of the maze. IIUC the shown level is a fixed validation-set seed which Uli used to visualize the checkpoint policies.
Written during SERI MATS, 2022 Winter cohort, at a little prodding from sensei Trout.
If you're trying to understand a policy, viewing how it changes over time is valuable even if you aren't interested in the training process directly.
For example, here's Lauro et al's neural net learning to solve mazes. Vectors are drawn by taking a probability weighted combination of the basis vectors, e.g. the vector x is given by pright−pleft.
You might notice some basic things
The network learns to avoid different walls at different times in training (see: bottom right and middle left). This rules out an architecture where the mouse sees locally around itself (of course, we already knew this. but I expect you can find more interesting phenomena after looking further)
Alex suggested a similar thing could be done with language models. Plot logits for a few sentences over time (e.g. continuations after a prompt trying to hurt a human), compare logit curves to the loss curve, and compare with when we start doing RLHF.
I would be extremely surprised if nobody has done this before, but thought I'd signal boost since it's relatively easy to do and interesting. (Also a gateway drug to my hidden agenda of studying training dynamics, which I think are important to understand[1] for alignment!)
Something something shard theory something something high path dependence (I'm taking stream of thought seriously lol)