Claude now has a horizon of 444 billion minutes(!)
Could you actually provide a citation for Claude already being a supercoder? If you can't, then either the model has wrong parameters or is wrong wholesale. What I expect is that the time horizon is exponential until the last few doublings, not hyperbolic. Additionally, I suspect that Claude's horizon is more due to surprisingly low performance on some tasks well below the alleged horizon.
As for models being woefully outmatched by humans before a specific period when your "benchmark" skyrocketed, it means a different thing. Recall that the METR graph had the models' performance rise quickly, then slowly until the spike at the very end, that the AI-2027 forecast estimated the human speed of thought as 10-20 tokens/sec and that the models, unlike the humans, can only have the CoT and stuff tokens into the mechanism which ejects the next one without learning anything from experience.
Were METR's baselining process simulated and placed into the METR graph with 20 tokens/simulated second of a human doing the task, the performance on ranges higher than the time necessary to introduce the baseliners to the tasks would likely resemble a straight line where 1K tokens is a bit lower than a minute and 100K tokens are a between 1 hr and 2 hrs. I manually edited the line into the graph and added another line where the hypothetical model requires 100 times more tokens. The models first don't display progress at all, then proceed faster (OpenAI's models) or about as fast as the humans (GPT-4o, Claude Sonnet 4.5, Grok 4), then ALL models begin to proceed far slower, almost as if their competence is exhausted by harder tasks, and finally models since o3 display a jump, as if they did something, weren't confident, but decided to submit anyway.
Could you actually provide a citation for Claude already being a supercoder?
I did not claim that Claude is a "supercoder" or even human-level at coding; rather, the Claude addendum continued with: "to be clear, we shouldn't over-interpret this specific 444 billion figure" and "Realistically, this highlights that to really make accurate projections of the time to catch up with human horizons based on METR data, we need better human baselines." In my view, the natural takeaway is that that Claude has now basically caught up with METR's existing human baselines, which they have acknowledged were not that well incentivized, which does not mean that it is better than properly incentived software engineers.
However, per the sensitivity analysis, if we assume well incentivized humans could do ~2x better than METR's baselines on METR's longest benchmark tasks, "then Claude 4.5 Opus has an intersection-based time horizon of only 35.9 minutes", ie far from human-level. So as I said in the post, I do think this highlights the need for better human baselines for METR, but while the current horizon estimates are quite sensitive to the baselines, the estimated time to human-level doesn't actually shift that much with this stronger baseline, i.e. from early 2026 to late 2026.
In general, the primary point of the post wasn't that the current baselines are good enough to make an accurate prediction of human-level horizons using METR data, but rather "my main takeaway from this analysis is probably that we shouldn't over-interpret the METR trends at fixed reliability as a direct marker of progress towards human-level software horizons" (because the METR metrics are likely underestimating the progress rate, due to using fixed reliabilities at all horizons)
"What I expect is that the time horizon is exponential until the last few doublings, not hyperbolic."
I provided both theoretical and statistical arguments (e.g. AIC) in the post for why the human-relative time horizon trend is likely hyperbolic rather than exponential, and your comment does not address or acknowledge either of those arguments. Note the post does argue that METR's metrics likely are exponential, so the hyperbolic claim is specifically about human-relative time horizon metrics (per the proposal in the post).
I notice that I am confused. You imply that the human-equivalent horizon of a model is Then the LOGARITHM of is and it is the LOGARITHM which likely behaves linearly if is constant and changes linearly or hyperbolically if changes linearly. Alas, doesn't change linearly across models. Instead, as far as I understand, is calculated as Were monotoneous, we would also expect monotoneous changes in the ratio of time horizons Instead, the ratios are this. Setting aside Claude Opus 4.5 with the ratio equal to 10.64, the next two biggest ratios are displayed by DeepSeek R1-0528 (8.53) and Grok 4 (7.14). Therefore, the ratio of the time horizons did NOT display a consistent trend at least before Claude Opus 4.5.
If you run a linear regression on versus time, then the regression line does have a positive slope estimate (even pre-claude-4.5), and I used that regression line in section 2.2.1.1 to provide an alternative estimate for when LLMs will catch up with human (at which point the denominator goes to zero, and the LLM's horizon blows up). That said, the trend is quite noisy; and while the OpenAI trend from that estimate was already stat sig, the overall trend across companies did not hit stat sig until the Claude Opus 4.5 datapoint. Also, as I argued in the post (partly due to the noisy trend): "I suspect it makes more sense to directly extrapolate the overall time-horizon estimate rather than linearly extrapolating the noisy logistic coefficient in isolation, even if the slope trend is a useful intuition-pump for seeing why a finite-time blowup is plausible" (btw, the specific projection in that section was based on just OpenAI instruct-tuned models, i.e. post gpt-3 models)
Also, the underlying question in this case was whether the LLM slope would catch up to human baseline slope, but it's somewhat moot since that has basically happened with Claude 4.5; and if METR were to collect better incentivized human baselines (with better slope ), it seems quite likely that there would be a similar catch up to match this improved , leading to another blowup in the updated (human-relative) LLM time horizons.
(edited)
The trend itself was this:
gpt_3_5_turbo_instruct 3.49
gpt_4 5.54
gpt_4_0125 4.47
gpt_4_1106 5.87
gpt_4_turbo 4.30
gpt_4o 5.48
o1_preview 4.76
o1_elicited 6.76
o3 4.39
o4-mini 4.93
gpt_5 5.18
gpt_5_1_codex_max 5.36
Neither I nor GPT-5.2 believe that THIS trend is consistent enough. Additionally, Claude Opus 4.5 had its share of doubts cast upon the abnormally high 50% time horizon. Finally, what would it mean for a hired human to have a 50% or 80% chance of succeeding at year-long tasks? That the human cannot do the task ~at all, even given 10 years? But even this example is not that an example...
Your link to chatgpt's analysis is not loading for me, but I don't really trust chatgpt to do this without mistakes anyway; when I run this regression in python statsmodels with METR's official values and release dates from their github (plus the recent gpt-5 models), it is stat sig for this OpenAI instruct-model trend (p ~ .04) and it gets more stat sig once we include Claude 4.5. I don't see what dates you are using, but your beta values have a fair amount of (rounding?) error compared to METR's data, and the model list isn't the same, e.g. they didn't include non-frontier mini models, etc. (btw, note that one-sided p-values are appropriate in this case since only positive slope would be treated as evidence of catching up).
But again, the main question from that particular trend/argument was whether LLMs were catching up with the human baseline slope, which Claude now has basically done for the existing baselines, so that seems pretty strongly confirmatory. It's true that Claude has a somewhat worse logistic intercept than gpt-5 models (associated w/ a bit worse short-task reliability), but it is still better than the human baseline intercept, and the net effect is that Claude beats the human baselines over a much longer range of horizons than other models (per METR's logistic fits).
As far as what it would mean for humans to not be able to complete really long/difficult tasks at high reliability, I wonder if that comes back to this argument from the post:
"Many people have the intuition that humans can handle tasks of arbitrary length at high reliability, but of course that depends on task difficulty, and while we can extrapolate the METR curve to weeks or months, the existing/actual tasks are short, so it's not clear how to estimate the difficulty of hypothetical long METR tasks. There is a tendency to assume these would just be typical long software engineering tasks (e.g. merely time-consuming due to many fairly straightforward subtasks), but there is not much basis for that assumption, as opposed to longer tasks on this length/difficulty trend being more like 'prove this tricky mathematical theorem', etc"
(edited)
TL;DR
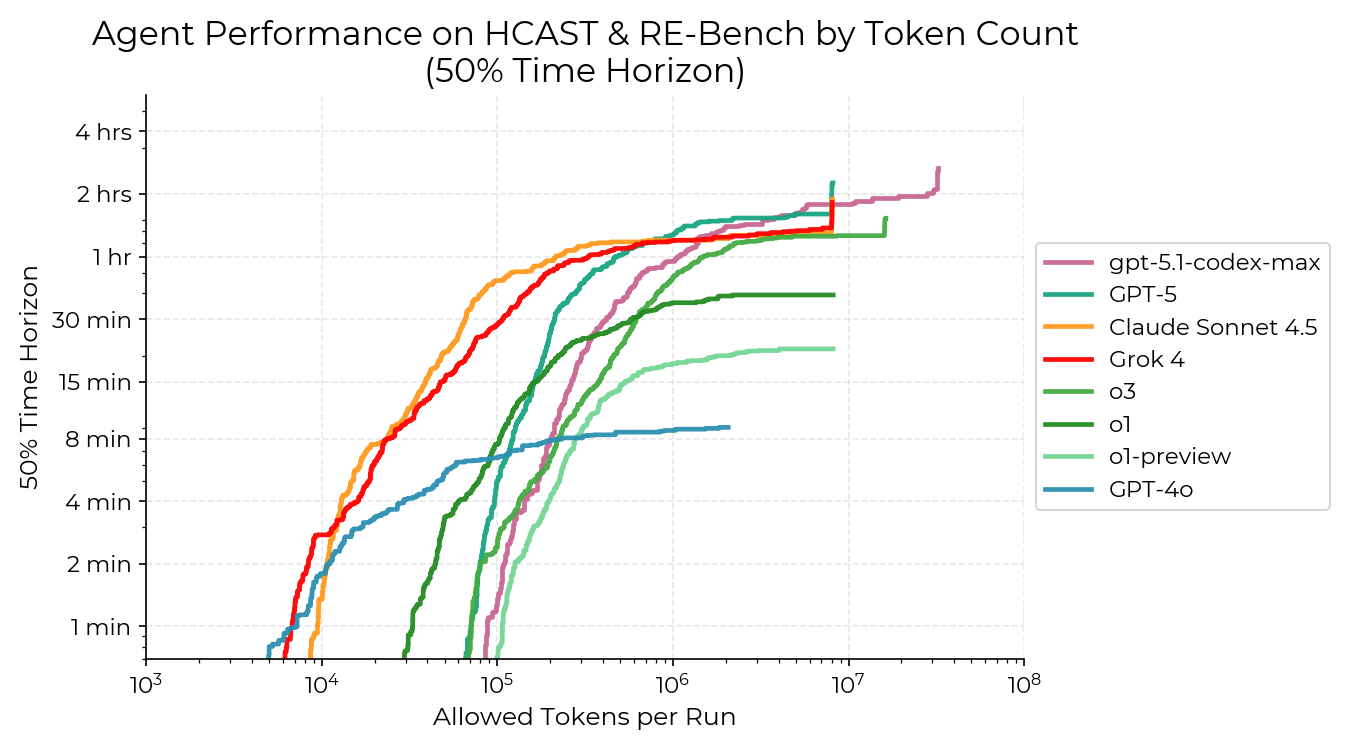
Figure 1: Plot comparing frontier LLM time-horizon measures, including both the human-level-reliability time-horizon from this post (orange), versus the METR-style fixed-reliability 50% time-horizons (blue). We can see that this alternative human-relative time horizon measure has been increasing much more steeply over time than the METR horizons. Note that the "human-level" horizon metric in this plot is comparing LLMs to METR's human baselines. The most recent data point included here is gpt-5.1-codex-max.
Acknowledgements: I shared a draft of these ideas last year in correspondence with Daniel Kokotajlo and Eli Lifland from AI Futures. Thanks to Eli for his feedback; also, Daniel subsequently posted a short-form [1] touching on a similar crossover/intersection point framing, which is worth checking out for his perspective on these issues.
1 Summary
The METR time-horizon metric provides estimates for the longest software tasks that a given AI is capable of completing [2]. This estimate is based on human baseline measurements for how long a set of software tasks took human engineers, with the (geometric) average time based on the subset of humans who succeeded at each task. METR also measured human reliability at each task, but rather than compare the AIs to those human levels, they have typically reported LLM time horizons at fixed reliabilities independent of task length (e.g. 50% or 80%). The METR estimates have featured prominently in efforts to estimate the timeline to human level long-horizon agency, e.g. per the AI-2027 forecasts[3]. The following bullets describe potential downsides of this METR horizon approach and summarize the proposed alternative, as well as providing trend-based projections for these metrics.
1.1 Potential Downsides of the METR Metric
1.2 Alternative Human-Relative Metric:
As an alternative to the fixed-reliability (e.g. 50%) METR time horizons, we can instead measure a time horizon metric that is defined relative to actual human baseline reliabilities; note that METR did actually measure human baseline reliabilities, though they tend to down-play those baselines as weak or insufficiently incentivized (see section 1.6 below) and instead focus on absolute reliability targets. One issue is that current LLMs e.g. gpt-5 already exceed the METR human baseline time horizons at both the 50% and 80% targets; however, humans do still have fatter tailed reliability curves, so for longer tasks METR's human baselines still do better (though see Addendum below on Claude 4.5, since this claim is less clear now). For instance, gpt-5 has worse reliability than the human baselines once the METR task length gets longer than 4.5 hr, but note its 50% horizon is only 2.3 hr. Using these human-reliability baselines, we can estimate LLM time horizons, as the longest task duration over which the LLM is more reliable than the METR human baselines, or more concretely, as the intersection point of METR's logistic fits for humans and LLMs, with a fit of reliability versus task duration. See Figure 1 for a plot comparing these two horizon metrics over time.
1.3 Trends in Human-Relative Metric (exponential fit)
The trend in this human-relative time horizon metric is increasing much faster than the existing METR trends, and assuming an exponential fit, the LLM time horizons at human-reliability are doubling every 1.9 months, versus every 7 months over the same time period for the METR (50%-reliability) time horizon trend (see Table 1 and Figure 2). In other words, every 1.9 months there is a doubling in the longest time horizon that LLMs can handle at METR's human baseline reliability. As METR has noted this exponential appears to have sped up recently, perhaps since the arrival of reasoning models, though the estimates above are just using all of the data for both metrics (not just the recent models); however, the hyperbolic analysis below does implicitly model increasing exponential rates over time.
1.4 Evidence for Super-Exponential (hyperbolic fit):
1.5 Projections to Reach Human Level (hyperbolic fit)
Per above, with an exponential fit, LLMs would never catch up with humans, but with a hyperbolic fit the current trend suggests human level by around mid 2026, relative to the (weak) METR human baselines (see Table 2). That table also shows sensitivity analysis with hypothetical stronger human baselines, with the two alternative baselines pushing human level into 2027. These stronger baselines have flatter slope, with human reliability dropping more slowly with longer horizons, but they still do gradually decline, in contrast to the METR horizons based on constant reliability targets.
1.6. Downsides of the Proposed Metric
METR has generally minimized the relevance of their human reliability baselines on the grounds that the participants weren't properly incentivized, and these weak baselines are a potential downside for this proposed metric; but in so far as we are trying to determine LLM progress towards human-level agency, then we are likely better off comparing to the available human baselines (even if imperfect) rather than absolute reliability thresholds that have no known connection to actual human performance; for instance, based on METR's human-baseline logistic fit, we should expect humans to get about 3% reliability for tasks at 1-month horizon (along the METR difficulty trend line), so it's not clear why we would require "human-level" AI to get 50% (or 80%). That said, in so far as the human baselines are weak or poorly incentivized, it could be useful to collect stronger human baselines, or for now we can do sensitivity analysis with hypothetical stronger baselines (see below) to assess how much this changes projections.
2 Horizon Trends
2.1 Exponential Model
Figure 2: Log plot of the proposed human-reliability LLM time-horizons, suggesting that an exponential fit is a reasonable approximation, though see below for model-selection analysis suggesting that a hyperbolic fit may be better. This regression shows a time-horizon doubling rate of approximately 1.9 months.
Table 1: Estimated doubling rates for the proposed human-reliability LLM time-horizon metric versus the METR 50%-reliability metric. Note that the METR horizons are doubling at a much slower rate, and if we assume status quo exponential progress, then 1 month horizons would come about 4 years sooner based on these human-relative time horizons. Note that these are the overall trends, not the recent (somewhat) faster trends. Also, see below for evidence that the proposed time-horizon metric may see super-exponential growth.
2.2 Hyperbolic Model
While the above exponential model for LLM time-horizons is a reasonably good fit, there are fairly strong reasons to think that a super-exponential (e.g. hyperbolic) model is a better match for tracking this metric, whereas an exponential fit is more defensible for the official METR time-horizon metrics (i.e. for their fixed reliability, 50% and 80% metrics). See Section 2.2.1 for theoretical evidence favoring a hyperbolic fit for this proposed human-relative metric and Section 2.2.2 for statistical evidence based on AIC model selection. Also, Table 2 shows the estimated time for LLMs to reach human-level over all time horizons, including estimates based on the measured METR human baselines and also additional sensitivity analysis showing how this estimate would push further into the future if we compared to (hypothetical) stronger or better incentivized human baselines. Note that with an exponential fit, the trend would never catch up to human level horizons, so this question only really makes sense in the super-exponential context.
One challenge with extrapolating the human-relative time horizons to human level is that it involves extrapolating the human logistic function far beyond where it was actually tested in the METR benchmark; so ideally we would also collect direct human measurements for much longer tasks than the current <1 day tasks. But given the expense of doing so, extrapolating the reliability logits could be a reasonable proxy, especially since they do appear to be surprisingly linear in task-duration.
Table 2: Projections for when LLMs will exceed human reliability over all time horizons, based on hyperbolic fit. The first row shows the estimate using the proposed human-relative metric calculated with the actual human baseline data from METR, but since METR has argued that the baselines were poorly incentivized, the remaining rows show projections if human reliabilities are actually higher on the hardest/longest METR tasks, i.e. 50% and 80% rather than the 22% (estimated from their measured human logistic curve); note that the human slope β is what is being varied in this sensitivity analysis to match the target reliabilities above, whereas the logistic intercept α is left unchanged from baseline. You can alternatively estimate dates for LLMs to reach human level by just projecting the LLM logistic slope linearly in time to estimate when it matches human slope, but see section 2.2.1 below for why I suspect this is less reliable than directly projecting the overall horizon progress.
2.2.1 Theoretical Evidence
One natural intuition regarding METR time horizons is that people can effectively handle arbitrary task lengths, but with an exponential trend the 50% horizon will always be finite, so you might wonder if the actual long-term trend will be super-exponential with a finite-time singularity (e.g. per AI-2027 projections); however, per the formulas in section 3 below, the 50% time horizons likely won't blowup to infinity unless β approaches zero (since β is in the denominator), assuming the logistic parameters α and β are finite/continuous, but zero slope (β) would mean no reduction in reliability with increasing task length, which is likely unrealistic (see more careful discussion of formulas in section 3 below).
On the other hand, for the human-level time-horizon formula, β−βh is in the denominator, so all that's required for a finite time singularity is for the LLM's parameters to catch up with human parameters. And currently the LLM intercepts (α) are already better than the human baselines, and the β slopes are increasing linearly over time (with substantial noise), so it's plausible that this could occur at a finite amount of time into the future, at which point AI could exceed the human baseline at all times. Also, since human reliability declines with task length, it is not surprising that it could be easier to exceed this performance over all possible time horizons; on the other hand, the 50% time horizons, require a fixed 50% reliability for arbitrarily long/challenging METR tasks, so it's much less clear whether it's feasible to achieve this over all task lengths.
2.2.1.1 Extrapolating LLM Slope-Parameter to Human Level
Unlike the trends in time horizons which tend to have tight fits with R2 > 0.8, the LLM logistic coefficient (slope) trend is quite noisy (R2 ~ .3), even if we limit to a single model provider (OpenAI) and exclude the noisy off-trend pre-instruct samples (gpt-2 and gpt3). I suspect part of the reason for this is that the LLM providers are presumably optimizing for overall time horizon, which can be optimized via various combinations of slope and intercept in the model's logistic fit, so there is little incentive to cleanly drive up the slope with each release, e.g. model/training changes that significantly improve the intercept α while slightly worsening the slope β could be a worthwhile tradeoff as long as they improve the overall time horizon. For this reason, I suspect it makes more sense to directly extrapolate the overall time-horizon estimate rather than linearly extrapolating the noisy logistic coefficient in isolation, even if the slope trend is a useful intuition-pump for seeing why a finite-time blowup is plausible. But if we do naively extrapolate the coefficient, this suggests a fairly long time to catch up with humans (~2029) with large error bounds, versus the shorter timelines implied by a direct hyperbolic fit, per Table 2 (i.e. ~2026-2027).
2.2.2 Statistical Evidence
Given the theoretical reasons for suspecting super-exponential (hyperbolic) trends for the proposed human-relative LLM time horizons, one question is whether we can see evidence for this in the available data, using standard model selection techniques. One challenge to comparing these two models, is that the exponential fit has only 2 parameters, whereas the hyperbolic function has 3 parameters. So we can't just directly compare likelihoods/mean-squared-error, and instead need some correction to penalize the hyperbolic for its higher model capacity. See Table 3 for results comparing exponential vs hyperbolic fit, using AIC with small sample size correction. The table actually reports Akaike weights, which are normalized to 0-1 for easier interpretation. This analysis generally seems to support the theoretical expectations from the previous section, with AIC suggesting a hyperbolic fit for the human-relative time-horizon metric, versus an exponential fit for METR's 50% time horizon.
For the hyperbolic results in Tables 2 and 3, I excluded the pre-instruct models since those data points were quite questionable; in particular, these pre-instruct models are in a different technical category from subsequent instruct-tuned models, and for gpt-2 they weren't even able to use the same agentic scaffold that was used for later models, and they had to impute many data points to zero; also, for gpt-3, the model was no longer available in the api at the time of the METR testing, so they had to use proxy model instead and then back-date it; actually the earliest instruction-tuned model (gpt-3.5) also used a proxy, so an argument could be made for excluding that data point as well, but excluding pre-instruct data is a natural Schelling point for focusing on higher quality samples. Also, looking at Figure 2, it appears that the pre-instruct data points (gpt-2 and 3) are outliers, and this is even more extreme in the plot of logistic slope β over time, where these dubious pre-instruct data-points are completely off the subsequent trend (plot not shown).
That said, these AIC results appear to be quite sensitive to which samples/outliers are included, so until we have more data (from future models), I think we should be fairly cautious in over-interpreting these AIC results. But perhaps in the next 6 months it will become more clear whether the data is following a hyperbolic with finite-time catch-up with the human baseline. Also, I do think it could also be better to use cross-validation rather than AIC for model selection in this case (since it's more empirical, less reliant on assumptions), but given the limited number of data points, I felt it wasn't worth the extra effort for now.
Table 3: This table shows a model-selection analysis comparing exponential versus hyperbolic fits, using AIC since the two models differ in capacity, with the hyperbolic having 3 parameters and the exponential only 2, so AIC penalizes this extra capacity and favors the exponential fit all-else-equal. This analysis suggests that METR's 50% horizon is more likely exponential, whereas the human-relative horizon is better modeled as hyperbolic. Note this hyperbolic model implies that LLMs would exceed the human baseline over all time-horizons at some finite time in the future (roughly in 2026), whereas with an exponential fit LLMs would never catch up to humans. This AIC analysis excludes the two pre-instruct data points (gpt-2 and gpt-3), for reasons explained in the text, but given the small sample size these AIC results are quite sensitive to which points are included and should be taken with a grain of salt. So while these AIC results are suggestive, probably the stronger evidence for a finite-time blow-up in time horizons comes from theoretical considerations (see section 2.2.1).
3 Technical Details (formulas)
In the METR analysis the reliability of both LLMs and humans is modeled with a logistic function in the human task durations (d), i.e.:
psuccess(d)=σ(α+βlog2d)Note this parameterization is slightly different from METR's, but equivalent. In the human case, their fitted intercept and slope are: αh=2.55 and βh=−.39. From the above logistic curve we can derive the formula for the fixed-reliability time horizons that METR publishes, e.g. here is the time horizon formula at 50% reliability:
H50=2−α/βOn the other hand, the proposal from this post is to instead estimate LLM time horizons relative to the human-baseline reliabilities. To do this we find the intersection point of the LLM and human logistic curves, which gives the time horizons below which the LLM is better than humans in reliability (or vice versa):
Hh=2(αh−α)/(β−βh)where α and β are the LLM logistic parameters, and αh and βh are the human baseline parameters. So for example for gpt-5, METR estimates the parameters as α=4.1 and β=−.58. So from this we can see that the 50% time horizon for gpt-5 (137 minutes) is actually longer than the 50% horizon for the human baseline (98 minutes), but gpt-5's human-reliability time-horizon is longer still at Hh=269 minutes (note you have to use unrounded param estimates to replicate this calculation). So this means that gpt-5 is more reliable than the human baselines for tasks under about 4.5 hr, but then because the human logistic has fatter tails, humans currently have higher reliability for all tasks longer than 4.5 hr.
Also, from the above Hh formula, we can see that the criteria for LLMs to match (or exceed) humans at every task duration is to match the human slope, in which case the time horizon estimate blows up to infinity (due to zero in the denominator); then if the slopes match, in order to exceed humans (rather than just match them) the LLM also needs to have a larger intercept, but that is already the case for LLM intercept estimates. On the other hand, for the 50% horizon to blow up to infinity in finite time (e.g. per AI-2027), the slope β would need to increase to zero from the current negative value (assuming well behaved α and β, e.g. finite, continuous), but that would imply no reduction in reliability with longer duration/difficutly tasks, which is perhaps not realistic.
For the hyperbolic projection of human-relative time horizons, I use a standard 3-parameter hyperbolic:
Hh=A(tc−t)mWhere Hh is the LLM time horizon ("_h" for human-relative), t is the current date/time, and tc, A and m are the three hyperbolic parameters, where tc can be interpreted as the date/time at which LLMs catch up to humans (i.e. the blowup date). Note that a potential alternative could be to use a super-exponential curve derived directly from the intersection-point formula above, though some implicit assumptions would be needed e.g. regarding how α and β change with time.
4 Conclusion
Overall, my main takeaway from this analysis is probably that we shouldn't over-interpret the METR trends at fixed reliability as a direct marker of progress towards human-level software horizons; for instance, I think it would be a mistake to argue that AGI is still many years off on the grounds that it could be years until 80% horizons reach months/years on METR's metric; rather, when the goal is to assess time until human-level AI, my view is that we should focus on the kind of direct human-level baseline comparisons that METR's existing metrics don't provide (despite superficial appearances that they do provide this).
That said, METR has raised legitimate concerns about the quality of their existing human baselines and whether they were properly incentivized, and it does seem like there would be quite a bit of value in measuring higher quality human baselines for these agentic tasks, or in the meantime, computing the horizons with the existing human baselines padded/improved per the sensitivity analysis above. Also, given the existing baseline limitation, there are pros and cons of using METR's fixed-reliability horizon metric versus the human-relative alternative from this post, and there could be value in reporting both measures. One concrete use-case for the the METR metrics is in cases where you just need to know if a model can meet some absolute reliability standard independent of human capability, though even in this use-case the interpretation can be challenging, given the unknown implicit difficulty trend, especially once the task duration exceeds the actual benchmarked tasks.
Addendum (Claude 4.5 Opus)
After I had mostly completed this analysis, the Claude 4.5 Opus METR results were released[5], and showed somewhat faster than expected horizon lengths; in particular, based on the human/LLM intersection-based horizon length emphasized in this post Claude now has a horizon of 444 billion minutes(!), versus 440 minutes for gpt-5.1-codex-max, which looks much closer to a hyperbolic blowup than exponential; to be clear, we shouldn't over-interpret this specific 444 billion figure, since as the LLM slope gets close to the human-baseline slope and the horizon blows up, the horizon estimate becomes really sensitive to estimation error, and both the human baselines and LLMs have reliabilities close to zero for such long tasks (at least in the METR logistic fits). That said, this Claude data point does support a picture where Claude is now better than the available human-baselines (on average) for all the task durations in the current METR benchmark and even for all practical task durations if we are willing to extrapolate the linear logit fits to tasks much longer than the existing METR benchmark tasks.
However, given METR's concerns that the human baselines were not adequately incentivized, we can also assess the new Claude model with respect to hypothetical stronger human baselines, per the sensitivity analysis in Table 2. For instance, if we assume that the hardest/longest METR tasks could be completed with a bit over 2x higher reliability than METR's existing human baselines (specifically 50% rather than 22% from METR's human logistic fit at 16hr), then Claude 4.5 Opus has an intersection-based time horizon of only 35.9 minutes, which is actually less than gpt-5.1-codex-max at 39.4 minutes. But note that that this (hypothetical) stronger baseline still doesn't push the blow-up date that much later, i.e. just to the end of 2026 per Table 2.
Realistically, this highlights that to really make accurate projections of the time to catch up with human horizons based on METR data, we need better human baselines. Whereas METR's fixed reliability metrics are likely an under-estimate of horizon progress, e.g. currently only 4hr 49 minutes for Claude, despite Claude being better than their own baselines for effectively all horizons (> billions of minutes per above). Though short of collecting high quality baselines, perhaps there is also some value in adjusting the human baseline to be marginally better, per the 35.9 minutes Claude estimate above, which likely has the benefit of preserving more realistic longer-term asymptotic behavior than the fixed-reliability metrics.
Claude slope vs intercept effects: Note that the extremely large Claude horizons from this intersection-point approach are mostly the result of their logistic slope basically catching up with humans (-0.38 human vs -0.40 claude-opus-4.5 vs -0.58 for gpt-5.1-codex-max); whereas Claude's logistic intercept was actually a bit worse than prior models. So the Claude slope (β) increased a fair bit ahead of trend, though this is a bit misleading since their overall hyperbolic blowup wasn't that far ahead of schedule (per Table 2, where "better than METR human baselines at every time" was predicted for Sept of this year, prior to the new Claude datapoint).
Note it could be worth redoing the statistical tests from this post to include the new Claude model, but I haven't gotten around to it, but it looks pretty clear that it will provide stronger support for a hyperbolic model given the abrupt blow-up in horizons.
subscribe link on substack
editing user tags: @Megan Kinniment @Parker Whitfill @Thomas Kwa @ryan_greenblatt
References
Daniel Kokotajlo shortform on time horizons: https://www.lesswrong.com/posts/cxuzALcmucCndYv4a/daniel-kokotajlo-s-shortform?commentId=P8qGMRnbEexaFB4s9
METR horizons paper: https://arxiv.org/pdf/2503.14499
AI-2027 Forecast (original): https://ai-2027.com/research/timelines-forecast
Greenblatt on METR timelines: https://blog.redwoodresearch.org/p/my-agi-timeline-updates-from-gpt
METR post w/ recent data: https://metr.org/blog/2025-03-19-measuring-ai-ability-to-complete-long-tasks/