This is a special post for quick takes by Natália. Only they can create top-level comments. Comments here also appear on the Quick Takes page and All Posts page.
A few months ago, Scott Alexander summarized some of my arguments against SMTM’s lithium hypothesis of the obesity epidemic. SMTM recently replied to Scott’s summary, and I’d like to address their points here.
Preamble
Before working through SMTM’s specific points, there’s a fundamental issue to address. For lithium to help explain the obesity epidemic, we’d need evidence that human activity meaningfully increased lithium exposure over time.
However, lithium exposure in the US appears to come primarily from natural rather than anthropogenic sources. I wasn’t aware of this when writing my original post, and I think it deserves careful consideration. As I’ll explain,
- Several US regions in the 1960s had drinking water lithium levels that exceeded — by dozens of times — levels found in several high-obesity regions of the US today. Those high levels are explained by features of the natural environment, such as lithology and climate.
- A 2022 study of US drinking water found that “Lithium in the source waters was mainly from natural sources” and “No correlations were found between Lithium and potential indicators of anthropogenic sources such as Co, Cu, and Ni that commonly present in Li-based industry leachate.”
- Some areas of Argentina have naturally occurring lithium levels roughly 100 times higher than what is found in American drinking water, yet these populations have low obesity rates.
I think this context is worth keeping in mind as we work through the specific arguments. Let me now turn to SMTM’s reply to each of Scott’s points.
Scott’s first point
Scott’s summary:
1. Do you agree with the obesity increase being gradual over the course of the 20th century, rather than "an abrupt shift" as you describe in ACH?
The SMTM authors appear to agree there’s little non-semantic disagreement between us on this question, so this can be skipped.
Scott’s second point
2. Do you agree that even medical lithium patients don't have enough weight gain to cause the obesity epidemic? If so, why do you think that getting a tiny fraction of that much lithium would?
Let’s go through SMTM’s reply.
This is a great question. Let’s say that on average, people have gained 12 kilos since 1970, but that patients only gain an average of 6 kilos when they start taking medical lithium. This would be some evidence that lithium exposure isn’t responsible for the entire change in obesity since 1970. But it would be quite consistent with the idea that lithium caused some of the change in obesity since 1970, potentially as much as 50%.
Let me clarify what this 6 kg figure means and why it's important. The “6 kg” figure refers to an estimate in my original post, in which I estimated that clinical doses of lithium cause “zero to 6 kg of weight gain in the long term.” To clarify: 6 kg represents the upper end of that range, and applies to clinical doses specifically – not trace doses. Many studies on the effect of lithium on weight find a much smaller effect, and those that find an effect closer to 6 kg are observational studies that include patients on other obesogenic medications, such as anti-psychotics. Controlled studies find a much smaller effect for clinical doses of lithium, often consistent with 0 effect. This was covered in my original post.
Moreover, as I said in my post, we want to explain a 22.5 kg change in average weight since the 1890s, not just the 12 kg change since 1970.
The SMTM authors follow that up with:
That said, we do think there’s some reason to suspect that lithium might be responsible for more than 50%. If everyone is already exposed to lithium in their diet, then the amount of weight gained by medical lithium patients when they add a higher dose will underestimate the total effect.
To avoid underestimation, you can directly look up the obesity rates of lithium patients back when obesity rates were low. Quoting my original post, in which I do that:
This can also be seen in studies that report the obesity rate or average BMI of patients taking lithium back when obesity rates were low. Chen & Silverstone (1990) (a review article that has been cited by SMTM) reviewed some studies reporting either of those figures, and in none of them was the obesity rate greater than 25% – even though most of those patients were probably on antipsychotics and/or TCAs as well [which are know to cause weight gain]. So it’s difficult to imagine how lithium exposure could explain why the obesity rate is greater than 30% in several countries.
But more fundamentally, even if the weight gain caused by clinical doses of lithium were arbitrarily high, “the idea that lithium caused some of the change in obesity since 1970” would only make sense if people nowadays are exposed to a lot more lithium than people in the 1960s, due to e.g. anthropogenic contamination. Are they?
Has lithium exposure even increased?
A Chemical Hunger states that drinking water lithium levels have increased in Interlude H: Well Well Well (a):
[A]re we being exposed to more lithium now than we were back in the day? Our best source for this is that 1964 paper, Public water supplies of the 100 largest cities in the United States by Durfor & Becker, which as you may remember is available on Google Books. They report a median level lithium concentration of only 2.0 ng/mL in the water supplies they analyzed. Based on this [and the 6-8.1 ng/mL modern groundwater median], the median level in US drinking water seems to have increased 3-4x since 1964.
But we don’t have enough data to estimate the average overall change in lithium in US drinking water with a few ng/mL of precision. Lithium concentration in water varies a lot by region; the variation across space and type of water source is far greater than 3x-4x or 6 ng/mL. Drinking water lithium levels exceeded 100 ng/mL in some cities in the 1960s and 1970s, as covered in Interlude G: Li+, with values above 10 ng/mL being ordinary in historical sources. The 6-8.1 ng/mL median from the USGS groundwater study is well within typical values found in historical sources. Moreover, the 1964 study was focused on cities. In comparison, the recent USGS dataset is much more expansive, containing multiple rural measurements from the Mountain West backcountry, which has high levels of lithium, unlike the 1964 study.
The substantial spatial variation also means that even if we knew that drinking water lithium levels had universally increased by 3x-4x, that would still not explain the obesity epidemic, since geographical variation was far higher than 3x-4x in the 1960s. We know that there were communities in the 1960s with dozens of times more lithium in their water than some communities in the 2020s. As an example using the data we have, someone in El Paso, TX (~81 ng/mL) or Lubbock, TX (~63 ng/mL) was getting a lot more lithium in their water than someone living in southeastern United States today (~2 ng/mL). Despite that, the latter is much more likely to suffer from obesity. Why?
This is especially true internationally: people in some areas of Chile and Argentina have >100x more naturally occurring lithium in their water than people in the US, and yet they have low obesity rates (7%-17%). A 3x-4x increase, even if it were clear that it had happened, is small compared to that.
Going back to SMTM's post, it also says that the tail end of exposure has increased even more. “Back in 1964, the maximum level they recorded was 170 ng/mL. In the modern data, the highest level is 1700 ng/mL, 10x higher.” But again, that is not an apples-to-apples comparison, due to the Mountain West backcountry measurements in the USGS dataset. In particular, the maximum value, 1,700 ng/mL, comes from this seemingly uninhabited point in Utah, which likely looks something like this.

We can go ahead and plot the coordinates of all values higher than 170 ng/mL across used wells in the USGS dataset.
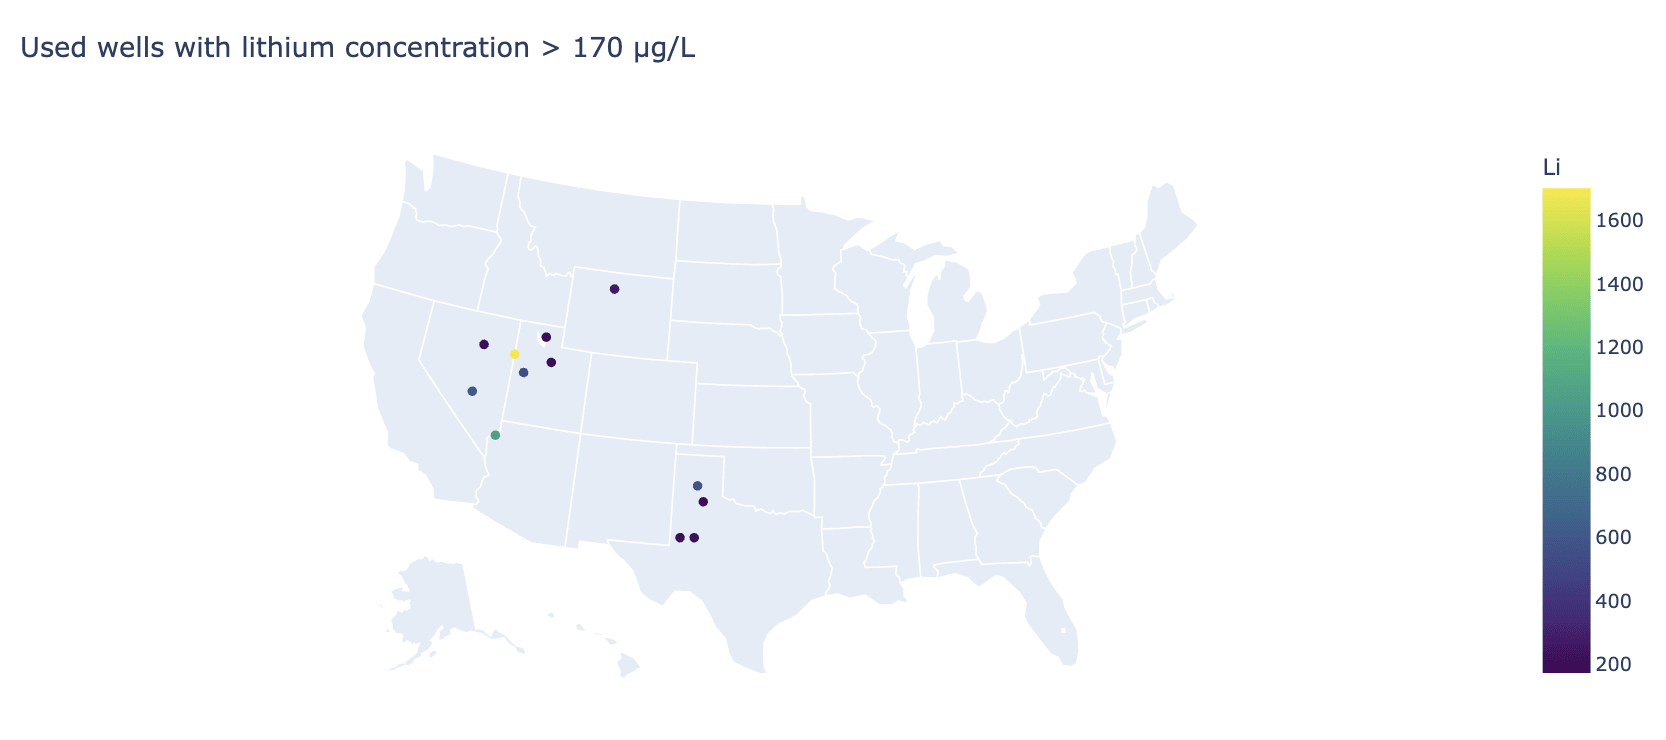
We can see that:
- they are very few, only 12 out of the 3,140 samples,
- nearly all of them are closer to 170 ng/mL than 1700 ng/mL, and
- nearly all are in very sparsely populated areas.
Lithium exposure is primarily natural, not anthropogenic
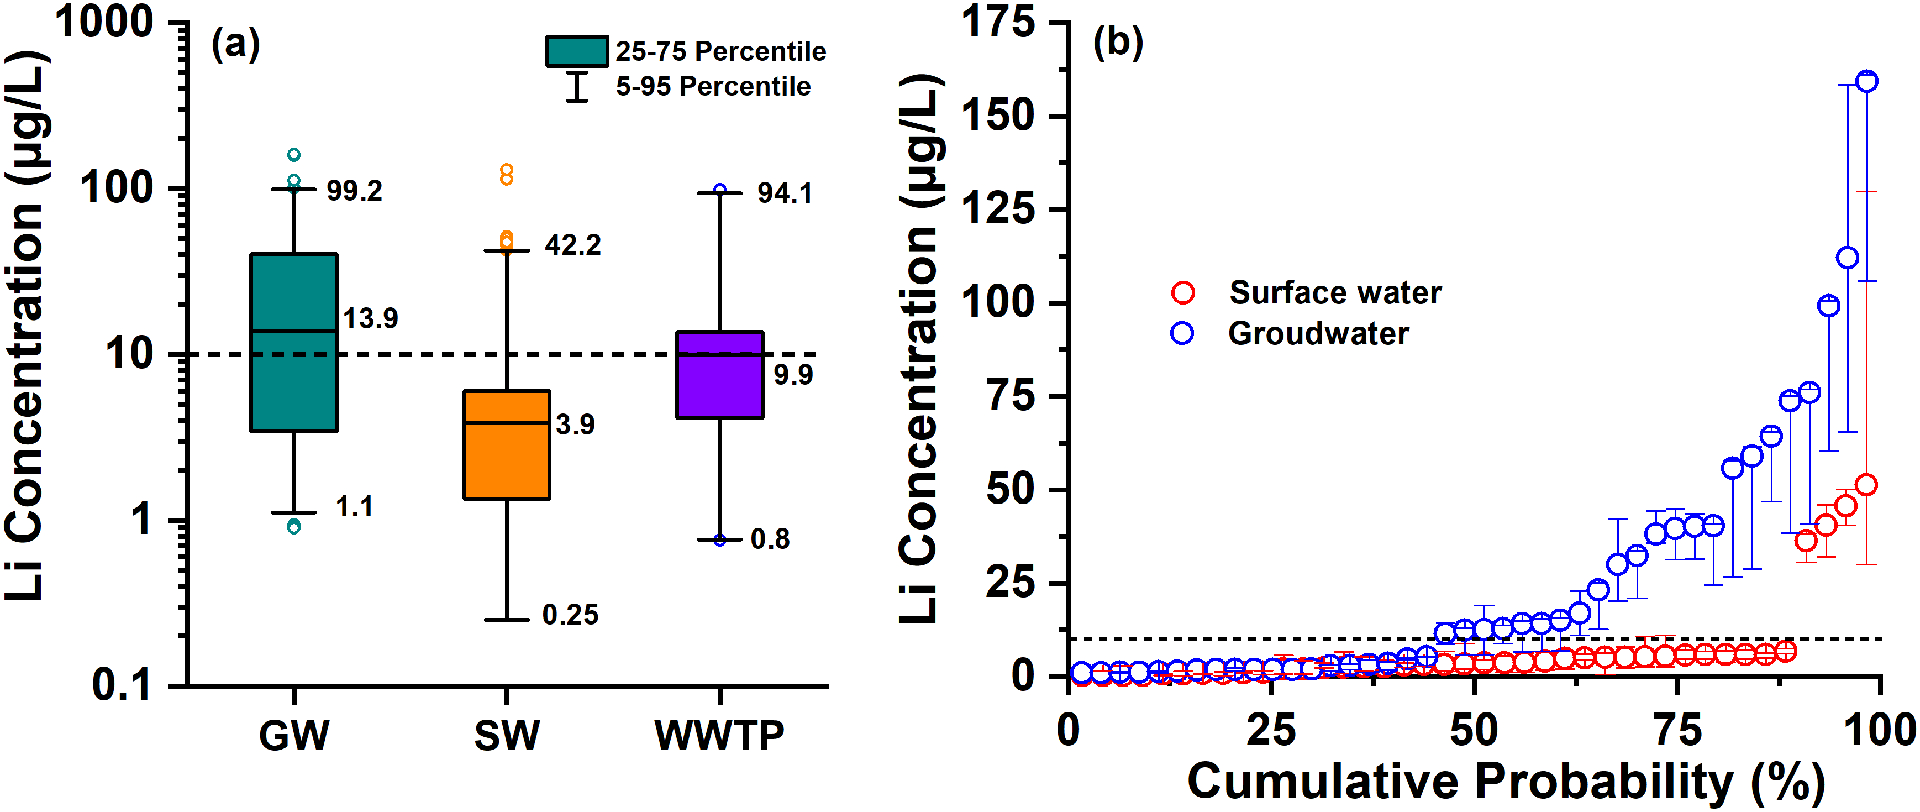
Overall, variation in lithium levels in drinking water appears to largely come from features of the natural environment, with human activity playing a minor role, if any. This 2022 study of drinking water in the US, both surface water (median 3.9 ng/mL) and groundwater (median 14 ng/mL), says this explicitly, stating that “Lithium in the source waters was mainly from natural sources” and “No correlations were found between Lithium and potential indicators of anthropogenic sources such as Co, Cu, and Ni that commonly present in Li-based industry leachate.”
If we want to explain the obesity epidemic with a contaminant, a contaminant for which variations in exposure are largely anthropogenic would be a better fit.
Of course, water is not the only source of lithium. Could it be that lithium exposure substantially increased through food, in a way that dwarfs spatial variation? There’s been some discussion about how much lithium there is in food (more on this later), but the SMTM authors don’t appear to have argued that it has increased over time, which would be necessary for the hypothesis to work, or propose a mechanism by which that could have happened. Instead, the 2024 post Lithium Hypothesis of Obesity: Recap, written years after the focus of their research shifted to lithium in food, still relies on water lithium levels to argue that lithium exposure has increased – the same numbers, 2 ng/mL for the 1960s and 6-8 ng/mL for the 2020s, that I addressed a few paragraphs ago.
So, there really is essentially no indication that lithium exposure has meaningfully increased due to anthropogenic activity, given the data we have, and especially not universally in a way that dwarfs geographical variation.
I think this by itself is more important than the rest of what I have to say. But we're still only halfway through Scott's second point. For completeness, let’s keep going through the next arguments.
As a reminder, Scott’s second point was:
2. Do you agree that even medical lithium patients don't have enough weight gain to cause the obesity epidemic? If so, why do you think that getting a tiny fraction of that much lithium would?
The SMTM authors bring up the Pima to address the second part of the question.
The Pima
[T]here’s at least one population (the Pima of the Gila River Valley [in Arizona]) where long-term exposure to lithium in food and water was associated with striking rates of obesity and diabetes, suggesting that under some conditions, lithium levels found in food and water may be enough to cause serious weight gain.
The Pima of Arizona were documented to have very high obesity rates. The best data I found was from this study, for which the obesity rate of 25-45 year olds exceeded 60% in the 1980s among men, and 70% among women.
SMTM “did some back-of-the-envelope math and estimated that the Pima might have been getting around 15 mg of lithium per day from wolfberry jelly.” To put this in perspective: if the 15 mg/day estimate is accurate, the Pima’s lithium consumption would be approximately 10x lower than clinical doses but ~400x higher than typical modern exposure. As I’ll explain later, multiple lines of evidence indicate that people (outside of very specific regions like the Andes) are exposed to roughly ~1,000x-10,000x less lithium than the typical patient taking lithium for bipolar. In comparison, 15 mg/day is only ~10x lower than a clinical dose, meaning that the Pima were likely getting hundreds of times more lithium than you. Scott’s question was likely about typical exposure, not the Pima’s (estimated) high exposure.
The Pima’s obesity rate of 60-70% was more than twice that of lithium patients in the same decade (<25%), despite the Pima receiving lower doses. Since many lithium patients were also taking other obesogenic medications, this pattern suggests that lithium alone cannot fully explain the Pima’s obesity rates. This suggests other factors are involved; maybe a weird and quite strong gene-environment interaction, with lithium or something else in their environment, limiting the usefulness of this data for explaining obesity rates in genetically dissimilar populations.
Moreover, we have examples of populations taking sky-high doses of naturally occurring lithium, close to SMTM’s estimate for the Pima, and remaining lean.
- In this study from Argentina, the median urine lithium concentration was 3.9 mg/L, which is absolutely insane: >100x higher than what we find in other areas. People pee out about ~1.5L of urine per day, meaning median exposure was roughly 5.85 mg/day, with the maximum in this sample being 14 mg/L = 21 mg/day. Meanwhile, the obesity rate of study participants, despite their staggeringly high lithium consumption, was 17%. These people likely get exposed to more environmental lithium per year than the typical person in the southeastern US does in a lifetime. And yet, their obesity rate is comparable to that of a lean European country.
- In this other Argentinean study from the same area, the average lithium urine excretion of participants was 1.6 mg/L, a bit less than 100x what we find in other areas, and the obesity rate was 7%, lower than the adult obesity rate of any European country.
Scott’s third point
3. Natalia lists several reasons to expect that trace lithium doses should have only trace effects – Gwern’s reanalysis showing few-to-no psych effects, some studies suggesting low doses have fewer side effects, and lack of any of the non-weight-gain side effects of lithium in trace users. What are your thoughts on this?
Scott’s summary is a bit under-defined: it’s easier to discuss explicit ranges of lithium exposure, instead of a term like “trace lithium” which is vague and can encompass several orders of magnitude. And, of course, “effects” itself is vague.
SMTM’s reply:
We think there are several reasons to expect effects from trace and subclinical doses, especially with extremely long-term exposure.
We’re only aware of one RCT of trace-level doses (Schrauzer & de Vroey, 1994), but this study found that taking 0.4 mg per day of lithium orally led to participants feeling happier, more friendly, more kind, less grouchy, etc., “without exception”, compared to placebo.
When we surveyed redditors who took subclinical doses of lithium as a nootropic (ballpark 1-10 mg/day), people commonly reported some non-weight-gain effects, like increased calm, brain fog, frequent urination, and decreased libido.
Regarding SMTM’s survey of Redditors supplementing lithium, it’s important to note that there don't appear to be reports of weight gain associated with a lithium dose under 20 mg/day. That seems more directly relevant to their hypothesis than the evidence of non-weight-gain side effects at lower doses.
Scott’s fourth point
4. Do you agree that wild animals are not really becoming obese?
The background is that I said this in my post:
[SMTM's source for the claim that wild animals are becoming more obese] only examined animal populations living in close proximity to humans; the “wildest” animal population they include is Norway rats living in human towns (and thus likely eating human food), which is probably not what people have in mind (a) when they think of “wild animals.” None of the animals in the study were in the wilderness or had wild diets.
The SMTM authors appear to have conceded this point:
Our use of the term followed our source, and while it’s natural that people misunderstood the term to mean something more broad, let’s clarify that we didn’t intend to imply we were making claims about mountain goats, sloths, or white-tailed deer.
I appreciate this clarification. However, the claim is still included in several posts of A Chemical Hunger. This means that future readers may read “wild animals are becoming more obese” and misunderstand what the authors believe, since “wild” typically means “living in a state of nature.”
Scott’s fifth point
5. Do you agree that water has higher lithium levels at high altitudes (the opposite of what would be needed for lithium to explain the altitude-obesity correlation)?
SMTM’s response:
No. This claim is based on an analysis that contains several mistakes.
Natália conducted an analysis of this dataset from the USGS and elevation data from Open Elevation API, and found a positive correlation of 0.46 between altitude and log(lithium concentration) in U.S. domestic-supply wells. We replicated this analysis and can confirm that’s the correlation coefficient you get. But this analysis is mistaken, for two main reasons.
First of all, the statistical problem. Correlation tests estimate the population correlation by looking at the correlation in a random sample drawn from that population. But this sample isn’t random, and it’s not representative either. The data mostly come from Nebraska, certain parts of Texas, and the East Coast. Some states are not represented at all. Really, look at the map below; it’s so much Nebraska. Even if there is a correlation within this dataset, there’s no reason to expect it’s a meaningful estimate of the correlation in the U.S. as a whole.
While no dataset is perfect, the USGS groundwater data was the best dataset I had at the time. As I explained in my post, I used data from “all wells whose coordinates were available.” The dataset provides evidence that drinking water lithium levels are higher at higher altitudes. SMTM’s argument is that the dataset may not be representative. This decreases our confidence, but not the direction of the evidence.
Moreover, we know why lithium concentrations in water are higher at higher altitudes in the US, making it less likely that the actual real-world correlation goes the other way. As this paper explains, it is due to the geology and climate of the Mountain West.
But even if this were a random sample, this analysis would still be mistaken, because it’s a sample from the wrong population. Natália’s analysis only covers domestic-supply wells. It excludes public-supply wells, and it entirely omits surface water sources.
This is a problem, because many people get their drinking water from public-supply wells, or from surface water. And it’s a problem because if there were a correlation between lithium levels and altitude, we’d expect to see it in surface water, not well water. Water drawn from wells has often been down there for thousands of years, while surface water is directly exposed to runoff, landfills, brine spills, power plants, and factory explosion byproducts. So we’d expect surface water to drive any correlation of obesity with altitude.
I covered this back when Scott wrote his summary. It’s true that not everybody gets their water from wells – roughly half of the US population does, the rest getting it from surface water. I (and SMTM at the time) focused on groundwater specifically because we have more data about it, and because it is known to have more lithium than surface water. Though they now suggest the opposite, the SMTM authors were originally concerned about increases in groundwater exposure explaining obesity. From A Chemical Hunger:
Well, back in the day, nobody got their water from deep, drilled wells. Nowadays, millions of people drink well water every single day. […] If water from drilled wells tends to have more lithium in it than water from shallow wells or surface water does, that would explain why people are exposed to more lithium now than they used to be, and could explain why the exposure is so universal.
Again, groundwater has more lithium than surface water, not less. This can be seen at all percentiles, with the difference being severalfold, as shown in this 2022 US study and this worldwide meta-analysis.
So current data do not appear to indicate that “runoff, landfills, brine spills, power plants, and factory explosion byproducts” result in surface water being unusually contaminated with lithium. As we have discussed before, the 2022 US study also explicitly says that lithium in drinking water (both groundwater and surface water) in the US comes primarily from natural sources, with little evidence of anthropogenic activity playing a role.
But what if well water usage is biased? Maybe people at higher altitudes are not using wells that often. That is what they argued in A Chemical Hunger, and they repeat this argument in their reply. From Interlude H: Well Well Well:
Colorado is the leanest state but has pretty high levels of lithium in its well water. Alabama is quite obese but levels of lithium in the well water there are relatively low. What gives? [...] But this doesn’t matter, because almost none of the drinking water in Colorado comes from wells. Instead, most of the drinking water in Colorado comes from surface water, and most of that water comes directly from pure snowmelt.
But notice how they only use this argument for Colorado, not the other high-lithium states. It turns out that Colorado is an outlier. The highest lithium levels in the nation’s wells are found in New Mexico, Utah, Arizona and Nevada, all of which get most of their drinking water from wells, according to the data we have available. In general, people in high-altitude states are more likely to get their drinking water from wells, not less.
This means all evidence we have points to people at higher altitudes likely having more lithium in their drinking water, in the US:
- Groundwater has more lithium than surface water,
- People at high altitudes get more of their drinking water from wells, and
- Wells at high altitude have more lithium.
A Chemical Hunger led many readers to believe that lithium explains why obesity is more common at lower altitudes in the US. In order for that to make sense, we’d presumably want positive evidence showing that lithium exposure is systematically higher at lower altitudes in the US – not just arguments about why it may be higher, despite available evidence we’ve seen pointing in the opposite direction. If we want to attempt to explain the altitude pattern with the contamination hypothesis (though as I’ve argued, that’s not necessary), it might be worth considering contaminants that show higher concentrations at lower altitudes.
Taking a step back from the individual points, I think it’s worth considering what would make the lithium hypothesis compelling as an explanation for the obesity epidemic.
SMTM’s responses demonstrate various ways the lithium hypothesis could potentially be consistent with the available evidence. However, I think the question Scott and other readers are interested in is: given the alternative explanations available, what makes lithium stand out as the “top suspect”? There are other potential contaminants to consider, as well as non-contaminant explanations. The SMTM authors have stated that “the evidence [is] compelling” and “the case in favor of lithium is quite strong,” while skeptics are “lithium deniers” engaging in “mental gymnastics.” I think what readers crave is an explanation of how that could be the case in light of the evidence I presented.
SMTM’s sixth point
We also want to call attention to a 6th point that Scott doesn’t mention. If we were to phrase it as one of his questions, it might go something like this:
6. You did a literature review of lithium concentrations in food and found that some foods contain more than 1 mg/kg of lithium, which implies that people might be getting subclinical doses from their daily diet. Natália disputes this and says that the best available data shows less than 0.5 mg/kg lithium in every single food. Do you agree?
In my original post, I pointed out that most studies of lithium concentration in food in the literature find low levels, compatible with a daily dietary intake of (very roughly) ~40 μg/day, thousands of times lower than the typical clinical exposure. The SMTM authors conducted original/independent research showing that the method used to analyze lithium in solid food affects the results, and in their opinion, higher values, which would put daily intake at closer to the 1 mg/day order of magnitude – only about 100 times lower than clinical exposure – are more accurate than values that yield lower results. In particular, they think HNO3 digestion, the method used in a lot of the literature, underestimates the concentration of lithium, whereas dry ashing is more accurate.
However, we can also look at food lithium levels in context with other measures. We can compare them with other indicators of exposure that don’t have the HNO3 digestion issue, such as lithium content in blood, urine and drinking water. And what we find is that 1) they are internally consistent, and 2) they are more consistent with a ~40 μg/day level of exposure than ~1 mg/day (outside of the areas of Chile and Argentina with very high naturally occurring lithium, and low obesity rates, that we've discussed above).
Blood
From my original post:
The Canadian Health Measures Survey found that the median whole blood lithium concentration was 0.000068 mEq/L in a nationally representative sample of 5,752 subjects, with data collected from 2009 to 2011. Whole blood lithium concentrations are 65% the value of plasma concentrations (a), which are in turn similar to those in serum, so that corresponds to a serum concentration of 0.0001 mEq/L. This value is 4,000 times lower than the lower end of the therapeutic range [0.4 mEq/L], and the 95th percentile (0.00029 mEq/L) is 1,383 times lower.
Those are comparisons against the lowest acceptable therapeutic serum concentration of lithium (0.4 mEq/L). A more typical value is 0.8 mEq/L, putting the general population median and 95th percentile at 8,000 times and 2,766 times lower, respectively.
Urine
Lithium is known to be largely rapidly eliminated via the kidneys. This means that urinary lithium excretion is a good marker of exposure. I searched for studies measuring lithium in urine and found:
- A median of roughly ~15 μg/L in Italian children, with a reference range of 4.8–71.7 μg/L in morning samples.
- A geometric mean of 9.6 μg/L and a range of 0.8-40.5 μg/L in the UK.
- A geometric mean of 23 μg/L and a range of 4-237 μg/L in Germany.
- A geometric mean of 23.5 μg/L in Japanese workers with no workplace lithium exposure.
- A median of 24 μg per 24 hours in a sample of people with end-stage kidney disease in the Netherlands.
More studies available here. In comparison, patients on therapeutic doses excrete a median of ~50 mg/L in their urine. But they also produce more urine, often ~3-4 L per day compared to the typical 1.5 L (though some don’t have this side-effect, and others can produce >10 L/day). Overall, urine excretion in these studies appears to be about ~30 μg/day, compared to 150-200 mg/day for patients on lithium therapy – roughly a 5,800x difference.
Total Diet Studies
Total Diet Studies, which the SMTM authors claim could be incorrect due to the method used for analysis, produce numbers consistent with the above, roughly 10 to 100 μg per day, 2,000 to 20,000 times lower than a typical therapeutic dose of ~200 mg.
Those three different lines of evidence of lithium exposure all fit together quite nicely. By contrast, dietary intakes above 1 mg/day would not make sense given this context. The contrast with the urine excretion data is particularly salient, since we expect nearly all lithium consumed to be peed out each day.[1] Values above the 1 mg/day range, even if they happened only occasionally, would also run into the problem I explained here: there would likely be other pieces of evidence of massive lithium exposure in the population, especially in vulnerable groups such as the elderly and those with kidney disease, who have difficulty eliminating lithium.
Which exchanges?
In their post, the SMTM authors say they had exchanges with “[me] and [my husband] Matthew,” that they “responded to our comments for a while” but “found [us] difficult to deal with,” and that this was part of why they didn’t respond to my post earlier. As far as I can tell, I wasn’t involved in those exchanges. They appear to have been with Matthew (1, 2) (who was not involved in writing my post, beyond briefly reviewing it), not me, and occurred in January 2022, before I read A Chemical Hunger in depth. I recall SMTM replying to me only once before.
They say some of those early exchanges were deleted; I looked for evidence of deleted conversations (e.g., tweets from SMTM replying to deleted tweets that could’ve been mine) and didn’t find any.
If I’m overlooking something, I’m happy to review any specific examples that involved me. My aim is simply to keep the timeline clear so readers can evaluate my arguments on their own terms, independently of Matthew’s separate exchanges.
- ^
From Schaller, 2013:
An increased absorption of lithium and its salts can be detected by analysing lithium in the biological body fluids, i.e. whole blood, serum, plasma, urine or saliva. In therapy control in the field of psychiatry, lithium is determined in plasma or serum (El Balkhi et al. 2009; Grandjean and Aubry 2009). The usefulness of saliva as a matrix for the detection of lithium is subject to debate (Obach et al. 1988). Urinalysis is preferred for the quantification of occupational or environmental exposures. In the literature, there are numerous data available for the parameter lithium in urine as reference value of environmental exposure (Abou-Shakra et al. 1989; Dol et al. 1992; Heitland and Köster 2004, 2006; Iguchi et al. 1999). Furthermore, the fact that more than 90% of the lithium absorbed by the organism is excreted via the kidneys is an argument in favour of lithium in urine as parameter (Arancibia et al. 1986).
In an Argentinian environmental study, it could also be demonstrated that lithium excretion with the urine is a good way of documenting the intake of lithium from the drinking water. To evaluate exposure to various toxic metals, the concentrations of 31 elements were analysed in the drinking water and in the urine of village inhabitants in a region with potential geogenic exposure. In 161 women from San Antonio de los Cobres in the province of Salta, a village with a very high lithium exposure (1000 µg/l) in the drinking water, the median lithium excretion was 4550 µg/l (range 852–14 300 µg/l) (Concha et al. 2010).
- ^
Impressive write-up! As a follow-up question, what's currently your favorite (hypothetical) explanation for the actual main cause of high obesity rates? Some environmental contaminant? Something else?
I would look into Zvi's most recent medical roundup from the section about yo-yo weight loss and regain to and including the section about miscalibrated satiety.