This is a special post for quick takes by StefanHex. Only they can create top-level comments. Comments here also appear on the Quick Takes page and All Posts page.
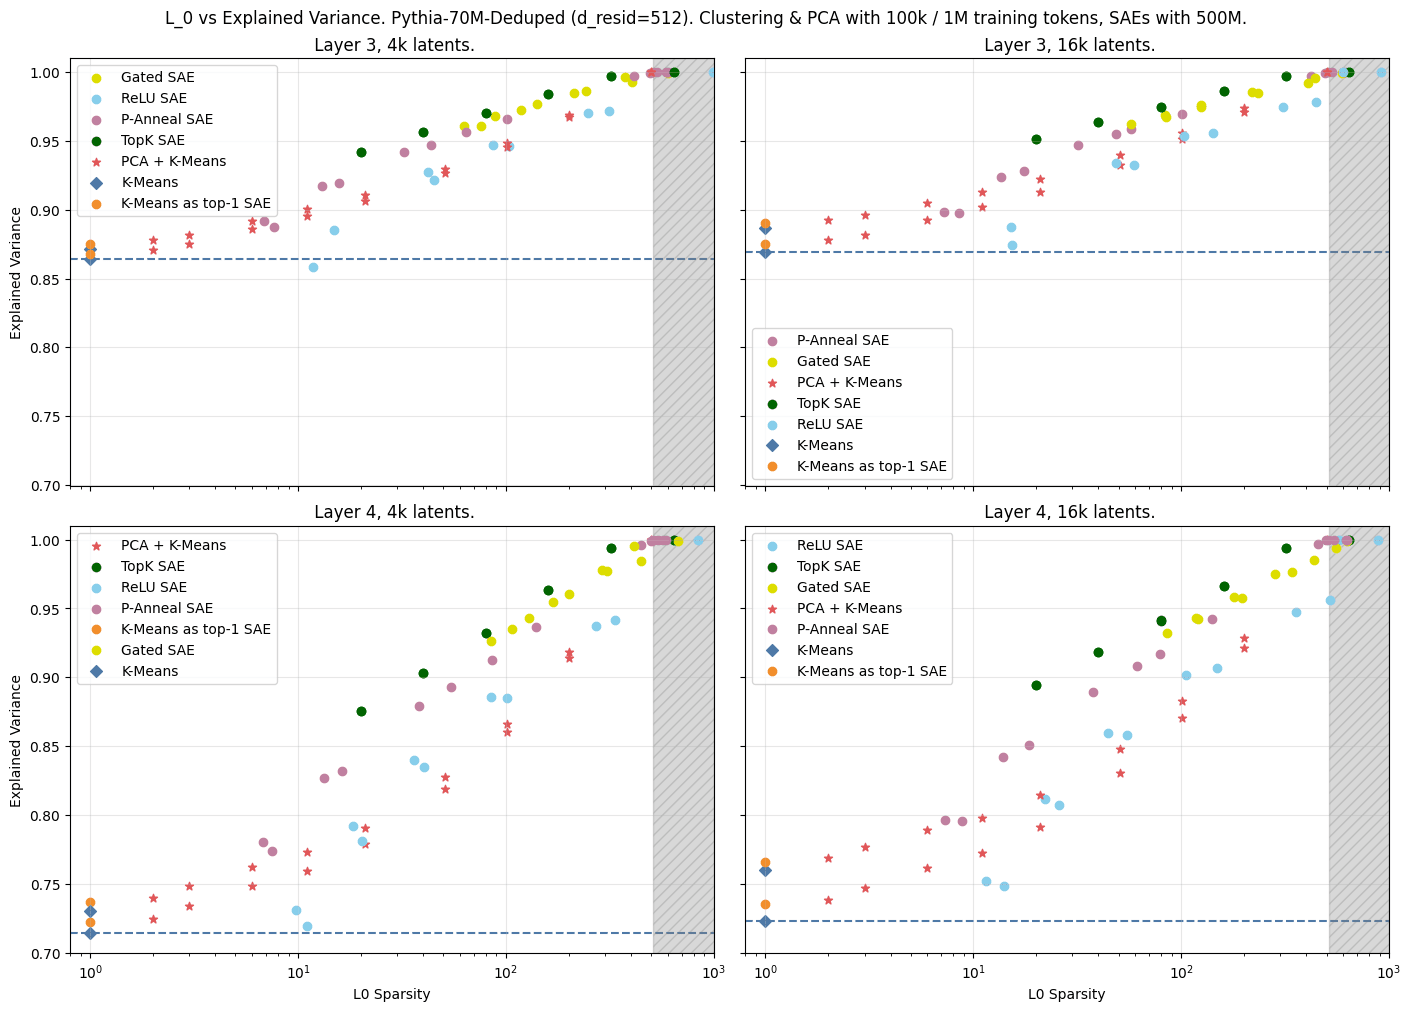
Edited to fix errors pointed out by @JoshEngels and @Adam Karvonen (mainly: different definition for explained variance, details here).
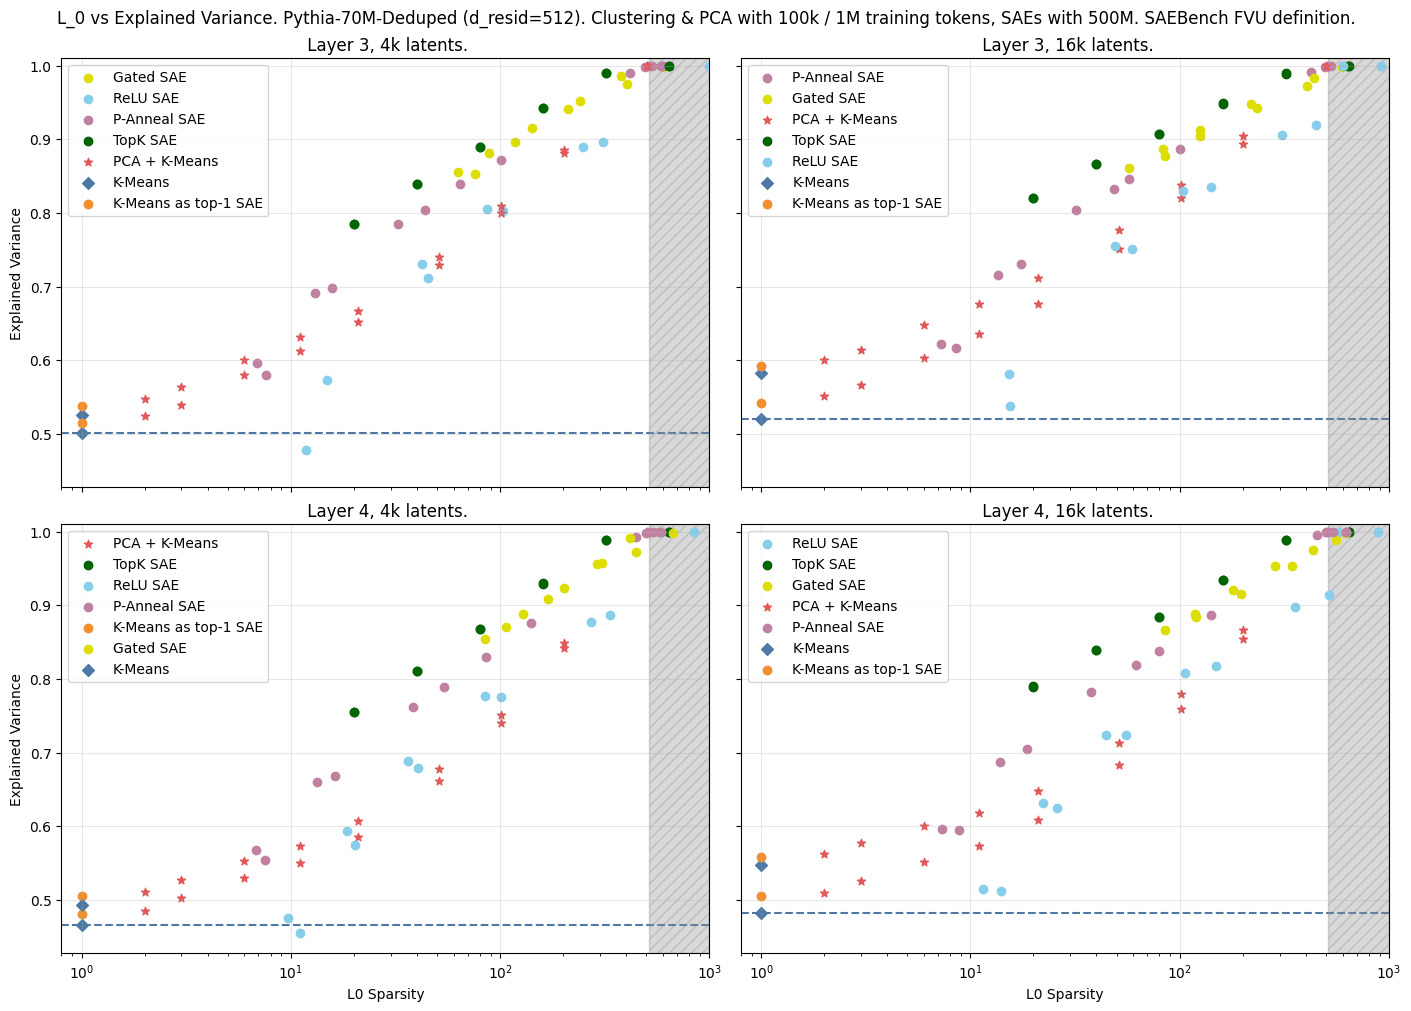
Summary: K-means explains 72 - 87% of the variance in the activations, comparable to vanilla SAEs but less than better SAEs. I think this (bug-fixed) result is neither evidence in favour of SAEs nor against; the Clustering & SAE numbers make a straight-ish line on a log plot.
Epistemic status: This is a weekend-experiment I ran a while ago and I figured I should write it up to share. I have taken decent care to check my code for silly mistakes and "shooting myself in the foot", but these results are not vetted to the standard of a top-level post / paper.
SAEs explain most of the variance in activations. Is this alone a sign that activations are structured in an SAE-friendly way, i.e. that activations are indeed a composition of sparse features like the superposition hypothesis suggests?
I'm asking myself this questions since I initially considered this as pretty solid evidence: SAEs do a pretty impressive job compressing 512 dimensions into ~100 latents, this ought to mean something, right?
But maybe all SAEs are doing is "dataset clustering" (the data is cluster-y and SAEs exploit this)---then a different sensible clustering method should also be able do perform similarly well!
I took this[1] SAE graph from Neuronpedia, and added a K-means clustering baseline. Think of this as pretty equivalent to a top-k SAE (with k=1; in fact I added a point where I use the K-means centroids as features of a top-1 SAE which does slightly better than vanilla K-means with binary latents).
K-means clustering (which uses a single latent, L0=1) explains 72 - 87% of the variance. This is a good number to keep in mind when comparing to SAEs. However, this is significantly lower than SAEs (which often achieve 90%+). To have a comparison using more latents I'm adding a PCA + Clustering baseline where I apply a PCA before doing the clustering. It does roughly as well as vanilla SAEs. The SAEBench upcoming paper also does a PCA baseline so I won't discuss PCA in detail here.
Here's the result for layers 3 and 4, and 4k and 16k latents. (These were the 4 SAEBench suites available on Neuronpedia.) There's two points each for the clustering results corresponding to 100k and 1M training samples. Code here.
What about interpretability? Clusters seem "monosemantic" on a skim. In an informal investigation I looked at max-activating dataset examples, and they seem to correspond to related contexts / words like monosemantic SAE features tend to do. I haven't spent much time looking into this though.
Both my code and SAEBench/Neuronpedia use OpenWebText with 128 tokens context length. After the edit I've made sure to use the same Variance Explained definition for all points.
A final caveat I want to mention is that I think the SAEs I'm comparing here (SAEBench suite for Pythia-70M) are maybe weak. They're only using 4k and 16k latents, for 512 embedding dimensions, using expansion ratios of 8 and 32, respectively (the best SAEs I could find for a ~100M model). But I also limit the number of clusters to the same numbers, so I don't necessarily expect the balance to change qualitatively at higher expansion ratios.
I want to thank @Adam Karvonen, @Lucius Bushnaq, @jake_mendel, and @Patrick Leask for feedback on early results, and @Johnny Lin for implementing an export feature on Neuronpedia for me! I also learned that @scasper proposed something similar here (though I didn't know about it), I'm excited for follow-ups implementing some of Stephen's advanced ideas (HAC, a probabilistic alg, ...).
I'm using the conventional definition of variance explained, rather than the one used by Neuronpedia, thus the numbers are slightly different. I'll include the alternative graph in a comment.
I'm going to update the results in the top-level comment with the corrected data; I'm pasting the original figures here for posterity / understanding the past discussion. Summary of changes:
1. [Minor] I didn't subtract the mean in the variance calculation. This barely had an effect on the results.
2. [Major] I used a different definition of "Explained Variance" which caused a pretty large difference
Old (no longer true) text:
[...]
1Andrew Mack
I think the relation between K-means and sparse dictionary learning (essentially K-means is equivalent to an L_0=1 constraint) is already well-known in the sparse coding literature? For example see this wiki article on K-SVD (a sparse dictionary learning algorithm) which first reviews this connection before getting into the nuances of k-SVD.
Were the SAEs for this comparison trained on multiple passes through the data, or just one pass/epoch? Because if for K-means you did multiple passes through the data but for SAEs just one then this feels like an unfair comparison.
 1
 1