Many of you have read Slime Mold Time Mold’s series on the hypothesis that environmental contaminants are driving weight gain. I haven’t done a deep dive on their work, but their lit review is certainly suggestive.
I think this is as good a place as any to point out that the SMTM authors have been repeatedly misleading about their evidence and unwilling to correct their mistakes, both on A Chemical Hunger and elsewhere. Here are a few examples that come to my mind at the moment:
- They claim that Texas “tends to be more obese along its border with Lousiana [sic], which is also where the highest levels of lithium were reported,” but their own source says that lower levels of lithium, not higher, are found along Texas's border with Louisiana. A commenter on their post has pointed out that error, as have I on a Twitter thread, but the authors have not edited their post or addressed this in any other way. (Incidentally, the correlation between drinking water lithium levels and obesity rates across Texas counties is negative).
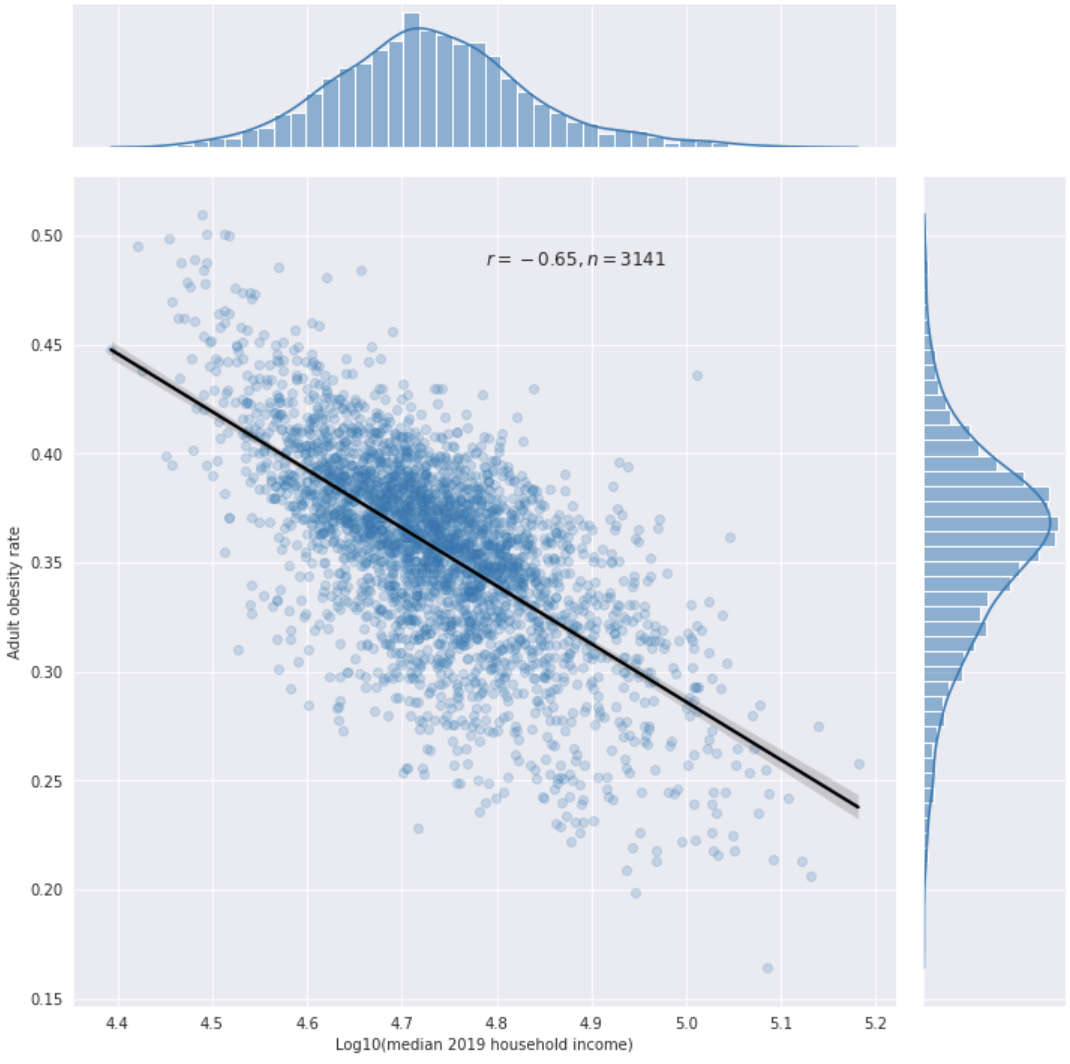
- They claimed on Twitter that geospatial associations between drinking water contaminants and obesity rates in the US are probably not confounded by SES, because “SES isn't really associated with obesity rates.” However, the correlation between obesity and ln(income) across n = 3110 U.S. counties was −0.486 in 2013, and my own analysis of 2019 data suggests the correlation was -0.65 in that year (using median household income data). [1] [2] [3] (Their response to the 2013 data [4] is pretty much just “this correlation didn’t exist 30 years ago,” but I don’t see how that supports their statement that “SES isn't really associated with obesity rates,” since that's a statement in the present tense rather than the past tense.)
- They claim that hypoxia probably cannot explain the effect of altitude on obesity, saying that “exercise in a low-oxygen environment does seem to reduce weight more than exercise in normal atmospheric conditions, but not by much.” However, when you read the abstract they linked to, you see that what they are calling “not by much” is a 60% increase in weight loss.
- In several posts, they claim that wild animals have been getting more obese, citing Klimentidis et al. (2010). However, that paper does not make that claim; it doesn’t even examine body weight data from wild animals at all. When confronted about this on Twitter, they provided evidence that some white-tailed deer populations under increased predation from humans have been getting heavier over the past several decades, but there’s archeological evidence that they are simply returning to their normal historic body size after being smaller than normal for a while due to a temporary decrease in predation by humans (which increased their population density and thus competition for food). For sources and more details, see this Twitter thread.
- (Unrelated to obesity) there's a post in which they claim that “Sicilian lemons really ARE more like polar bear meat than they are like West Indian limes, at least for the purposes of treating scurvy” (implying that Sicilian lemons have lower vitamin C content than West Indian limes and polar bear meat). I investigated this and found that West Indian limes have ~60% of the vitamin C concentration of lemons, and that polar bear meat has much less vitamin C than either (but that all three of those can still prevent scurvy if eaten regularly at not-extremely-large portions, and lemons and limes both have enough to treat it).[5] They have been contacted about this, and their response was that we don't know whether historical Sicilian limes had enough vitamin C to treat scurvy or not. Clearly, that is different from asserting (as they do in the post) that we know they don't have enough vitamin C. But they have not edited their post.
ETA: What I initially said on point 5 was wrong (specifically, I embarrassingly confused lemons with limes at some point), and I have now fixed it.
- ^
- ^
Individual-level data yield a much weaker correlation (in my own analysis of NHANES 2017-2020 data, the correlation is -0.14 for white women in their 30s and 40s, and -0.05 for white men of the same age). But NHANES only records income levels in multiples of the poverty line up to 5, and individual-level data is known to be noisier than county-level data, so that probably explains the discrepancy. Moreover, in that specific context (figuring out whether geospatial associations between drinking water contaminants and obesity rates are confounded by SES or not) county-level data are more relevant than the individual-level data.
- ^
For comparison, my own analysis suggests that the correlation between altitude and obesity rates across US counties (which the SMTM authors think is a big deal) is -0.35. The altitude value I used for each county in my analysis was the average altitude of the centroids of its census tracts, which gives you the closest thing to a population-weighted average altitude by county that you can get with cheap and fast computation. I haven't published the details of this analysis yet, but you can ask me for the Google Colab notebook and I'll share it with you.
- ^
They address the 2013 data in the paragraph starting with “The studies that do find a relationship between income and obesity tend to qualify it pretty heavily.”
- ^
Livers tend to be more vitamin C-rich than other tissues in the animal body, so I looked for data for them too, and found that, for several animals, their vitamin C content ranged from lower than that of West Indian limes to higher than that of lemons. So West Indian limes did not stand out in my data as being unusually lacking in vitamin C.
Tl;dr: I created a dataset of US counties’ water contamination and obesity levels. So far I have failed to find anything really interesting with it, but maybe you will. If you are interested you can download the dataset here. Be warned every spreadsheet program will choke on it; you definitely need to be use statistical programming.
Many of you have read Slime Mold Time Mold’s series on the hypothesis that environmental contaminants are driving weight gain. I haven’t done a deep dive on their work, but their lit review is certainly suggestive.
SMTM did some original analysis by looking at obesity levels by state, but this is pretty hopeless. They’re using average altitude by state as a proxy for water purity for the entire state, and then correlating that with the state’s % resident obesity. Water contamination does seem negatively correlated with its altitude, and its altitude is correlated with an end-user’s altitude, and that end user’s altitude is correlated with their average state altitude… but I think that’s too many steps removed with too much noise at each step. So the aggregation by state is basically meaningless, except for showing us Colorado is weird.
So I dug up a better data set, which had contamination levels for almost every water system in the country, accessible by zip code, and another one that had obesity prevalence by county. I combined these into a single spreadsheet and did some very basic statistical analysis on them to look for correlations.
Some caveats before we start:
The correlations (for contaminants with >10k entries):
Of these, the only one that looks interesting is trihalomethanes, a chemical group that includes chloroform. Here’s the graph:
Visually this looks like the floor is rising much faster than the ceiling, but in a conversation on twitter SMTM suggested that’s an artifact of the biviariate distribution, it disappears if you look at log normal.
Very casual googling suggests that TTHMs are definitely bad for pregnancy in sufficient quantities, and are maybe in a complicated relationship with Type 2 diabetes, but no slam dunks.
This is about as far as I’ve had time to get. My conclusions alas are not very actionable, but maybe someone else can do something interesting with the data.
Thanks to Austin Chen for zipping the two data sets together, Daniel Filan for doing additional data processing and statistical analysis, and my Patreon patrons for supporting this research.