Yesterday I learned that the CDC actually provides zip code-level (well, technically, Zip Code Tabulation Area-level) obesity rate estimates on their website. Using them, these are the correlations I found, for contaminants with >10,000 entries:
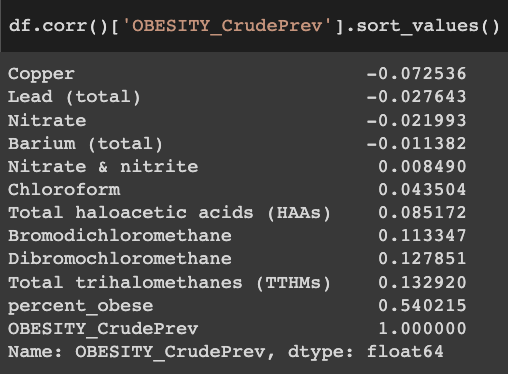
Unfortunately, you can see that there is a very low correlation between the obesity rates in this ZCTA-level dataset ("OBESITY_CrudePrev") and the "percent_obese" column in your dataset (0.54). As far as I know, all of these small area obesity rate estimates are created with fancy statistical modeling and interpolation to deal with missing data and small sample sizes, so this probably reflects differences in statistical methodology.
I don't know which dataset is better. And, to make matters worse, when looking into this I found county-level obesity rate estimates on the CDC website (from the Diabetes Surveillance System) that have very low correlations with both of these!
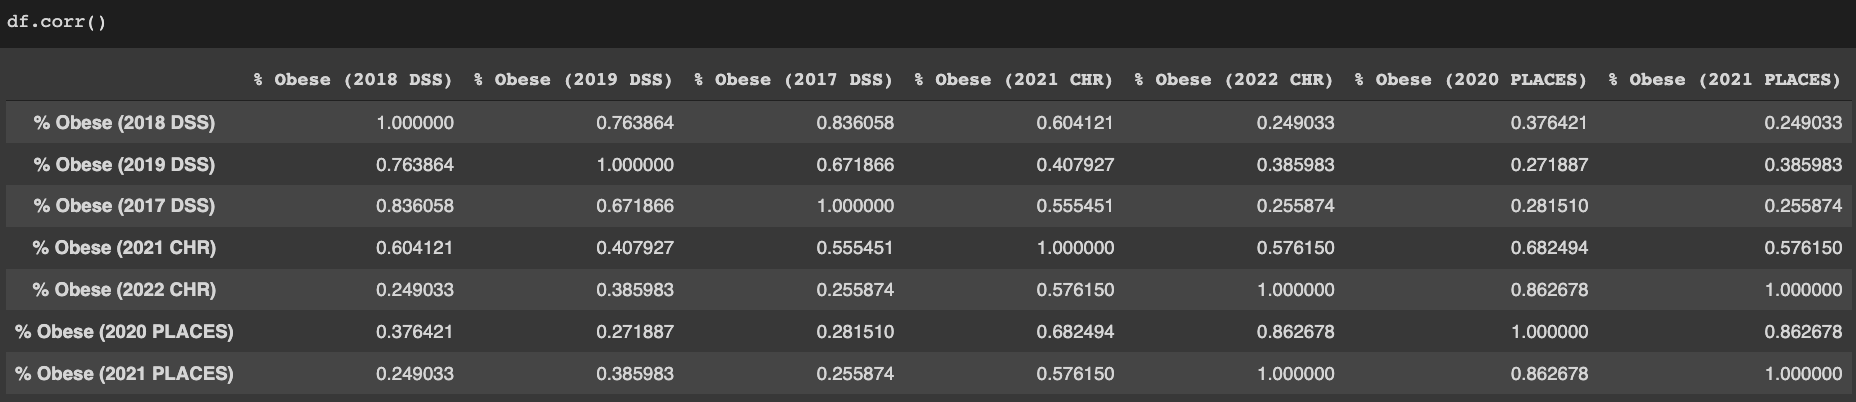
("DSS" stands for Diabetes Surveillance System, "PLACES" is the CDC project that created ZCTA-level estimates and also has its own county-level estimates, and "CHR" refers to the County Health Rankings. Elizabeth's dataset uses data from the 2021 edition of the CHR. The 2022 edition uses a dataset identical to the 2021 release of PLACES.)
Here are a few differences between the datasets that I've noticed:
- The PLACES and 2021 CHR estimates substantially negatively correlate with median household income and % Asian, but the DSS estimates barely do at all. (N = almost all counties).
- The PLACES estimates weakly positively correlate with log(groundwater lithium concentration).[1] By contrast, lithium and log(lithium) are both weakly negatively correlated with the DSS and 2021 CHR obesity estimates. (N = approximately 1/10 of all counties).
- The DSS estimates have sharp state boundaries: Texas and Georgia, for example, look a lot less obese than surrounding states. Those sharp borders do not exist in the 2021 CHR or 2021 PLACES estimates:
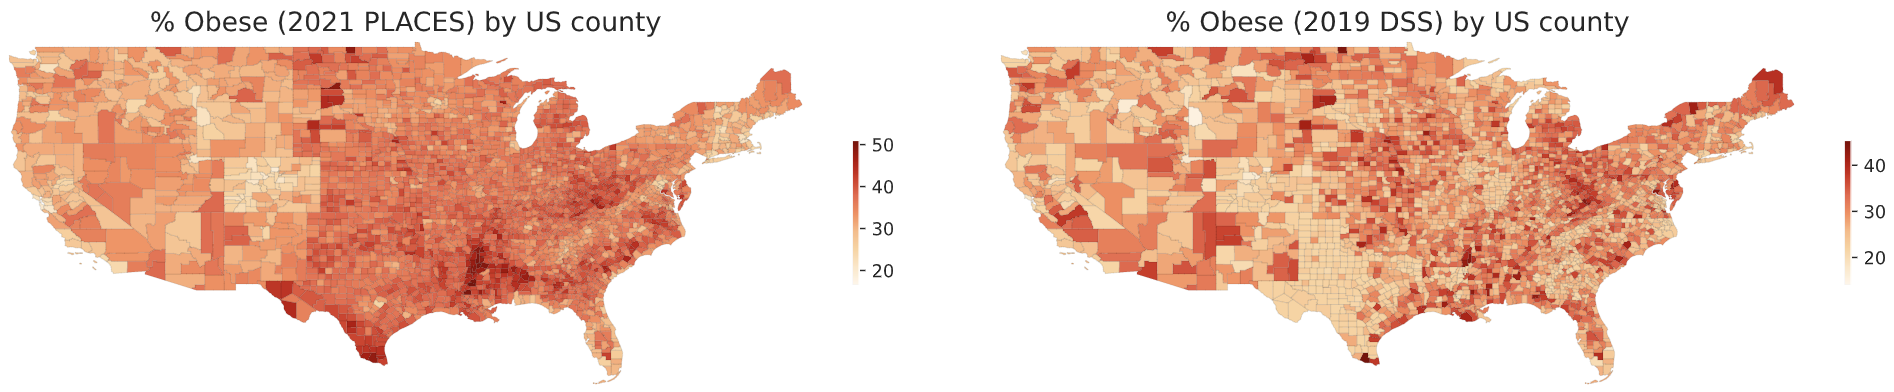
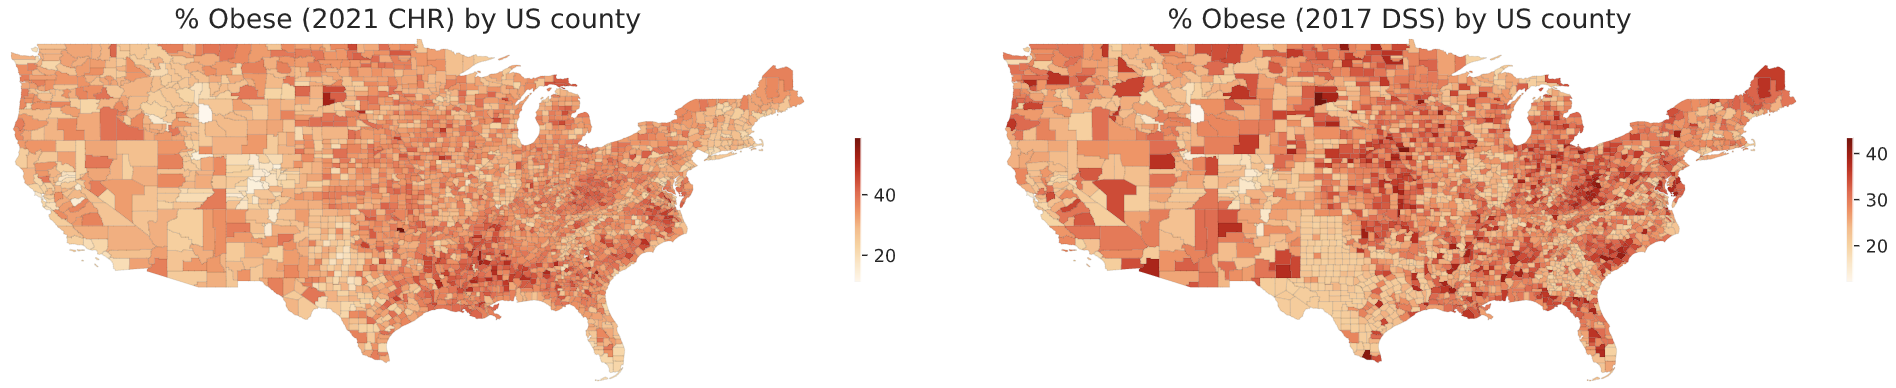
PLACES is a new project, so most of the older county-level obesity estimates seem to be from the DSS. But the DSS has changed its method of making estimates recently, and this seems to have had substantial consequences: a substantial negative correlation with income had been found in their estimates in 2013, before the change, even though I could find no correlation with the DSS's new estimates.
I hope someone tells me that I downloaded the wrong DSS datasets somehow, because all of them are really weird and I don't know what to do with them. The lack of a meaningful correlation between % Asian and obesity rate in those datasets, despite the fact that Asian Americans are much less likely to be obese than everyone else in the US, is extremely suspicious, as are the sharp state borders. But I probably shouldn’t just ignore them. For now, I guess I might just take a reasonably-weighted average of all datasets and use that when investigating what correlates with obesity rates?
I'd also want to know where the 2021 CHR dataset comes from? This page (control-F "2021") seems to indicate they use PLACES data, but this document indicates they use 2017 DSS data, and in practice, their dataset doesn't correlate well with either of those. I am probably misunderstanding something. Or maybe that data is from before the DSS changed their methodology.
- ^
I obtained groundwater lithium concentration data from here. The dataset provides explicit coordinates for a subset of the wells, and that was the data I used to obtain county-level lithium concentration estimates. I haven't managed to figure out the coordinates for the wells in the rest of the dataset.
Tl;dr: I created a dataset of US counties’ water contamination and obesity levels. So far I have failed to find anything really interesting with it, but maybe you will. If you are interested you can download the dataset here. Be warned every spreadsheet program will choke on it; you definitely need to be use statistical programming.
Many of you have read Slime Mold Time Mold’s series on the hypothesis that environmental contaminants are driving weight gain. I haven’t done a deep dive on their work, but their lit review is certainly suggestive.
SMTM did some original analysis by looking at obesity levels by state, but this is pretty hopeless. They’re using average altitude by state as a proxy for water purity for the entire state, and then correlating that with the state’s % resident obesity. Water contamination does seem negatively correlated with its altitude, and its altitude is correlated with an end-user’s altitude, and that end user’s altitude is correlated with their average state altitude… but I think that’s too many steps removed with too much noise at each step. So the aggregation by state is basically meaningless, except for showing us Colorado is weird.
So I dug up a better data set, which had contamination levels for almost every water system in the country, accessible by zip code, and another one that had obesity prevalence by county. I combined these into a single spreadsheet and did some very basic statistical analysis on them to look for correlations.
Some caveats before we start:
The correlations (for contaminants with >10k entries):
Of these, the only one that looks interesting is trihalomethanes, a chemical group that includes chloroform. Here’s the graph:
Visually this looks like the floor is rising much faster than the ceiling, but in a conversation on twitter SMTM suggested that’s an artifact of the biviariate distribution, it disappears if you look at log normal.
Very casual googling suggests that TTHMs are definitely bad for pregnancy in sufficient quantities, and are maybe in a complicated relationship with Type 2 diabetes, but no slam dunks.
This is about as far as I’ve had time to get. My conclusions alas are not very actionable, but maybe someone else can do something interesting with the data.
Thanks to Austin Chen for zipping the two data sets together, Daniel Filan for doing additional data processing and statistical analysis, and my Patreon patrons for supporting this research.