Great post, I wish more longtermist grantmakers wrote about this.
To copy over some of my comments:
My general reaction is that while I agree that prioritization is more important between buckets (especially the "future-improvement" conversion) than within them, the BOTEC maximalism framework as illustrated with these examples is much less convincing between buckets than within, which seems like a mismatch. Founders Pledge's climate grantmaking team elides this entirely while remaining quantitative by exploiting shared structure in uncertainties across interventions to make robust-ish judgments about relative comparisons without necessarily committing to any unit conversions and such, seems worth contrasting. (You did note that you do this too when cheap.)
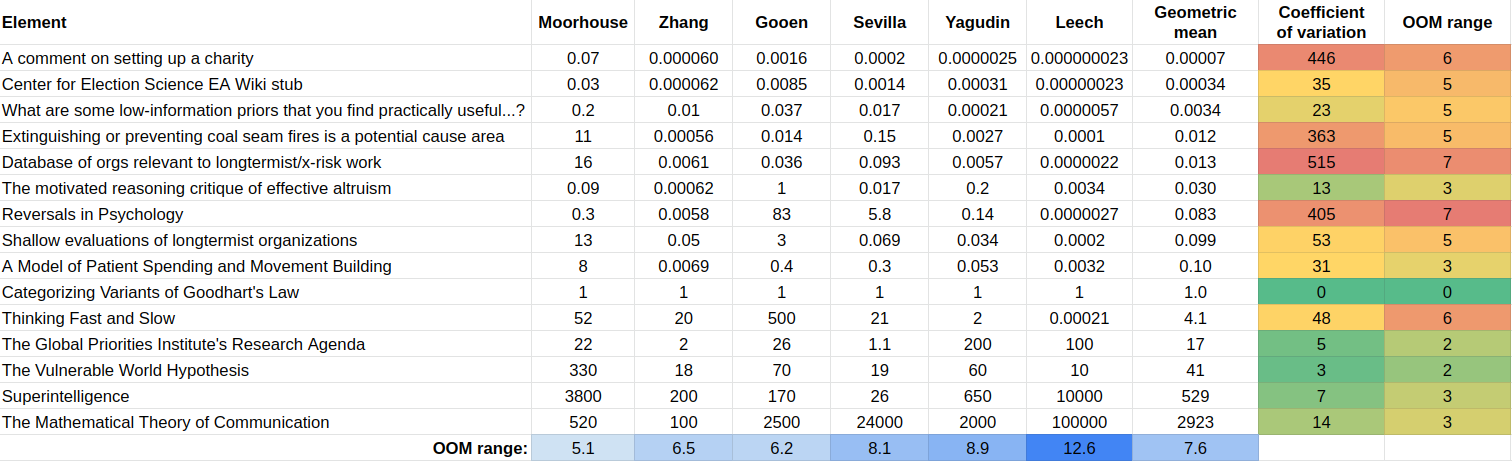
You also do mention having a bunch of cached takes on how good various intermediate desiderata are and how those all cash out to future-improvement, but given that you can't publish them I have to take your word for it, which I guess is fine. I would be keen to see others publish it though, since Nuno Sempere's experiment to elicit valuations of research from Fin Moorhouse, Gavin Leech, Jaime Sevilla, Linch Zhang, Misha Yagudin, and Ozzie Gooen using a pairwise comparison-based utility function extractor app led to both inconsistent preferences and wide-ranging disagreements, which makes me think people should compare notes on this more:
I also find it kind of wild that you can find many decent opportunities in the 1-20x range on your bar since I'd anchored to Linch's old $100M per bp (0.2-0.9x) being a bar at which he'd feel bullish about funding, which I guess means I still haven't internalised how wide the the between-buckets range can get, or it could mean you're more like Gavin above (widest valuation range) than Fin (narrowest), and I don't really know where to land on this valuation range spectrum.
such AI seems worse than the aliens that would otherwise claim a large fraction of the lightcone.
Any moral intuitions for why so? It seems to me that alien civilisations could also suffer loss of control or gradual disempowerment to AI, or any spectrum of scenarios between these and retaining 'agency' whatever that means. Do biologically evolved lifeforms definitely have positive moral valence?
This is great! Might I suggest basis points for the numerator unit, since the quantities are so small. Then the unit can be “bips per billion“, with your reference quantity at 20bps/$B.
That would be fine too.
"Points" suggests absolute; "%" suggests relative; my current unit is relative-ish and using points might be confusing.
I don't know why but I usually think in terms of cost per unit good, not good per unit cost. I said "1% future-improvement per $5B" but I really think like "$5B per 1% future-improvement."
I don't know why but I usually think in terms of cost per unit good, not good per unit cost. I said "1% future-improvement per $5B" but I really think like "$5B per 1% future-improvement."
These two old GWWC posts (1, 2) argue for using good per unit cost since that's arithmetically more convenient/intuitive in relevant scenarios. Most relevant excerpts below:
[Unlike consumers making day-to-day purchases (e.g. when you want to buy exactly one chocolate bar, and you are interested in comparing how much money you can save by choosing between various shops),] donors are usually interested in the differences in how much good they can do with a given amount of money, rather than the differences in how much money they can save for a given amount of good they want to do.
And:
What the considerations in post I and this post suggest is that it is usually wise to report cost-effectiveness in terms of DALY/$ rather than $/DALY, because then
- the comparison of differences in cost-effectiveness that we care about are more conspicuous, as the differences could be obtained by simple subtraction and;
- the most often relevant averages of cost-effectiveness could be reached simply by taking the familiar arithmetic mean, rather than the more cumbersome harmonic mean.
It feels like the grantmaking around me is only partially moneyball-pilled, or it's only somewhat competent at moneyball. There's alpha in putting numbers on stuff, if you can do it right.
Five months ago I wanted to compare a bunch of different kinds of donation opportunities. I needed a universal unit of cost-effectiveness, and for that I needed a unit of goodness. Consider a value scale where "EV of the multiverse" is 100 and "EV of the multiverse, in the counterfactual where the Sun goes supernova now" is 0. My default unit of goodness is 1% future-improvement, which means going from 100 to 101. For context, if P(AI takeover) = 40%, and AI takeover entails zero value,[1] then the value of decreasing P(AI takeover) by one percentage point means increasing P(no AI takeover) from 60% to 61%, which is worth 1%/60% = 1.7% future-improvement.[2] And magically decreasing P(AI takeover) to zero is worth 70% future-improvement (since 100%/60% = 1.7). And I think everyone is magically perfectly thoughtful, careful, wise, beneficent, coordinated, etc. is worth +900%, but that's unstable. Crucially, all sorts of desiderata cash out in terms of this unit.
(I think other reasonable units of goodness include "1 percentage point (or basis point, or micro-) AI takeover reduction" and "51:49 (or 50.01:49.99) update against AI takeover." Some interventions cash out in desiderata besides takeover reduction, but you can deduce conversion rates.)
My default unit of cost-effectiveness is 1% future-improvement per $5B.[3] If a donation opportunity is 1x the unit, that's (1/5B)% future-improvement per dollar. If it's 50x, that's (1/100M)% future-improvement per dollar. This unit is arbitrary — you could use a different number in place of 5B; I just chose 5B because it made many decent opportunities in the 1-20x range (according to me) and I prefer numbers around that size.
Illustrative BOTECs
Here are some back-of-the-envelope calculations (BOTECs) to show how you can compare interventions using my cost-effectiveness unit. Some numbers here represent my real beliefs and some are arbitrary placeholders — in reality using great numbers is crucial but for now I want to illustrate the concept without getting bogged down by specific numbers.
OP last dollar project. Around 2020, OP thought a weak lower bound on the cost-effectiveness of large-scale x-risk-reduction grantmaking was $200T per world saved from bio x-catastrophe. That's (slightly better than[4]) 100% future-improvement for $200T. Relative to the 1%/$5B unit, that's (100%/$200T)/(1%/$5B) = 0.0025x.
Alex Bores. If AI safety champion Alex Bores winning his US House election is worth 0.25% future-improvement, and a marginal $1M boosts him by 6%, that's (0.25%*6%/$1M)/(1%/$5B) = 75x on the margin.
AI safety super PAC. Suppose going from no AI safety super PAC to a $50M AI safety super PAC is worth 0.1% of US government is great on AI safety forever and US government is great on AI safety forever is worth 30 points of takeover reduction. At P(AI takeover) = 40% each point of takeover reduction is worth 1%/(1-40%) = 1.67% future-improvement. So that's (0.1%*30%*1.67/$50M)/(1%/$5B) = 5x on average.
AI safety nonprofits (with the current distribution of funders). Suppose one year of the AI safety nonprofit ecosystem reduces P(AI takeover) by 0.8 percentage points and increases the value of the future in worlds without AI takeover by 0.6%, for a total of 0.8%*1.67 + 0.6% = 2% future-improvement. Suppose the AI safety nonprofit ecosystem consumes $1B/year and increasing its funding by 1% increases its value by 0.1% — less than 1% because there's diminishing returns in quality of people/projects and there's diminishing returns as the low-hanging AI safety fruit gets plucked (and the funders don't get all of the credit, or people have opportunity cost — this is big overall but I think it's small when increasing funding on the margin). That's (2%*0.1%/$10M)/(1%/$5B) = 1x on the margin.
Also, Linch's old bar. Quote.[5] If x-risk is 45%, 1 point x-risk reduction is 1%/(1-45%) = 1.82% future-improvement, so .01 points x-risk reduction for $100M or $300M is (0.01%*1.82/$100M or $300M)/(1%/$5B) = 0.9x or 0.3x. But that was in late 2021 EA dollars; if those are worth 4x as much as 2026-01-01 EA dollars (really it depends on the domain or how savvy the donor/grantmaker is), Linch's bar was more like 0.2x or 0.07x in 2026-01-01 dollars.
Miscellaneous remarks
Good numbers are crucial. When you use BOTECs to determine cost-effectiveness, obviously your numbers are crucial. My real BOTECs look like these but with thought behind each parameter.
Most people are bad at putting numbers on parameters, such that doing so won't help them prioritize; their conclusions will be driven more by their errors than by true differences between opportunities. I think I'm good at it in many cases, but I won't justify that here and you don't need to trust me. It's related to having good intuitions about math and numbers, plus perhaps skills related to forecasting and trading. And it's important to have lots of subject-matter context and to put numbers on everything for a while and debate with others and resolve the big inconsistencies in your views.
The most confusing part of many of these BOTECs is the "future-improvement" number. I have a bunch of cached takes on how good various intermediate desiderata are, so I can just think about how the interventions affect the intermediate desiderata and then use my cached take on how those desiderata convert to future-improvement. Unfortunately I can't publish this stuff.
Credible intervals. How much should you update based on your BOTECs showing that one intervention is better than another? It depends on your prior evidence and on how confident you are in your numbers (and modeling). So in some cases you should use credible intervals (frequently incorrectly called "confidence intervals").
Make narrower comparisons when possible. If two interventions cash out via the same desideratum, you can compare their effect on that desideratum rather than evaluating their absolute cost-effectiveness. Or as long as you use the same number for that desideratum's value in both cases, your uncertainty about its value cancels out. That said, you generally want to do more than compare specific interventions; absolute evaluations are great.
The margin. Average cost-effectiveness is generally 1.5-50 times as good as marginal cost-effectiveness. You should be cautious when BOTECing average cost-effectiveness to evaluate marginal cost-effectiveness, or comparing average cost-effectiveness for one thing to marginal cost-effectiveness for another. Make sure you know what your numbers represent. I don't have good heuristics about estimating marginal cost-effectiveness based on the average; you just have to think case by case.
Money is not a monolith. Large-donor nonprofit money is much cheaper than small-donor political money. You have different bars for different kinds of money.
Thanks to Eric Neyman and Mo Putera for suggestions.
This post is part of my sequence inspired by my prioritization research and donation advising work.
It's not clear whether AI takeover is better or worse than supernova. A paperclipper is better than nothing because the AI can acausally trade with agents with good values, but bad because such AI seems worse than the aliens that would otherwise claim a large fraction of the lightcone. I heard this point from Ryan Greenblatt.
In defining and using my "1% future-improvement" unit, I make some nonobvious assumptions:
If you disagree with these assumptions, you may want a slightly different unit.
The bigger P(AI takeover) is, the better reducing P(AI takeover) by one point is relative to "better futures" interventions which increase value in worlds with no AI takeover.
Perhaps the unit should be pegged to e.g. 2026-01-01 dollars; dollars get less valuable over time. (Well, in many cases waiting to donate is good, but you should at least prefer money sooner because you can get investment returns.)
If bio x-risk is 2%, then shifting 1 point from "bio x-risk" to "no bio x-risk (but maybe AI takeover)" is worth 1%/98% = 1.02% future-improvement.
> Here are my very fragile thoughts as of 2021/11/27:
> Speaking for myself, I feel pretty bullish and comfortable saying that we should fund interventions that we have resilient estimates of reducing x-risk ~0.01% at a cost of ~$100M.
> I think for time-sensitive grants of an otherwise similar nature, I'd also lean optimistic about grants costing ~$300M/0.01% of xrisk, but if it's not time-sensitive I'd like to see more estimates and research done first.
Suppose your BOTEC is a product of parameters. Assuming the parameters are log-normal,* we can express a parameter's 50% credible interval as median⋇q for some q. (⋇ is like ± but for multiplication/division. For example, ⋇3 means 1/3 to 3 times the median. No uncertainty would be ⋇1; lots of uncertainty would be like ⋇30.) Further assuming the parameters are independent, we can calculate that the credible interval of the product of distributions with credible intervals ⋇q and ⋇r is ⋇e^(√(ln^2 q + ln^2 r)), and with more parameters you just add more summands. Or the credible interval of the product of the ⋇q distribution with itself n times is ⋇q^√n. (This works for 50% credible interval or 80% or whatever, since for lognormal distributions those are just scalar multiples of each other and of the logspace standard deviation.)
For example, if a cost-effectiveness estimate is the product of 4 independent parameters with credible interval ⋇1.3 each, then the overall credible interval is ⋇1.3^√4 = ⋇1.7. And then the 50% credible interval on the ratio between two such interventions is ⋇(1.7^√2) = ⋇2.1. So given these numbers, if an intervention looks 2.1x as good as another, there's a 75% chance that it is indeed better — all the worlds except where we're on the wrong side of the ⋇2.1 50% credible interval.
*Pedants who ask "probability distribution of what exactly" can consider the probability distribution for EV we'd assign to a parameter if we thought about it for a long time (but not so much that we're oracular). Note that this means the distribution's uncertainty is less than your uncertainty about what an oracle would say.