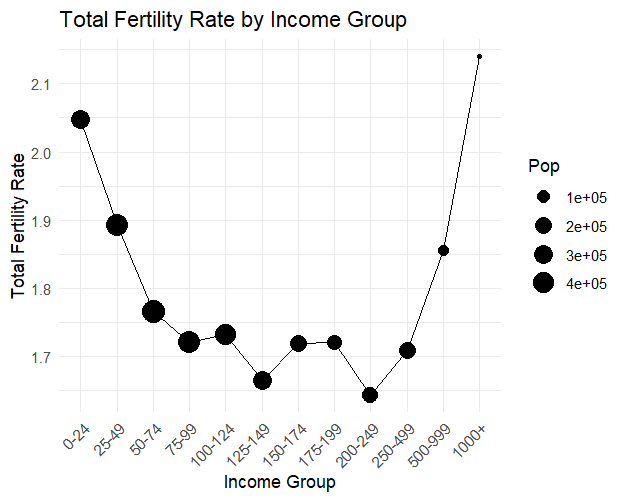
Looking just at an U shaped graph isn't very informative, as it neglects the relative size of the population. You can actually see from the circle size in your third graph that there are much fewer people on the right side (high income) of the U shape. This doesn't warrant optimism. One has to actually look at a scatter plot and at the correlation coefficient.
At least on a country level, the correlation between IQ and fertility is strongly negative:
The Pearson correlations between national IQ scores and the three national fertility indicators were as follows; Total Fertility Rate (r = − 0.71, p < 0.01), Birth Rate (r = − 0.75, p < 0.01), and Population Growth Rate (r = − 0.52, p < 0.01). source
This looks very bad.
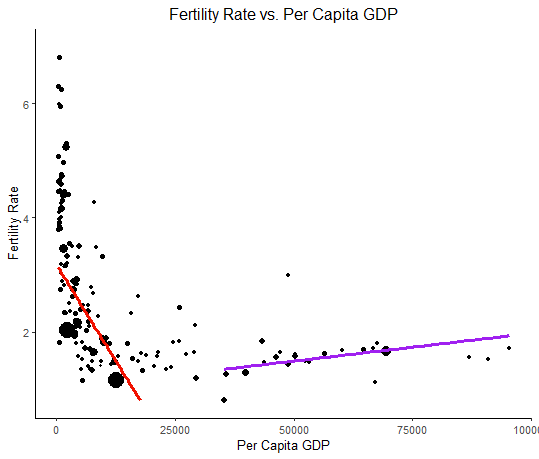
You also mention data supporting an apparent reversal of the trend in a few high income countries. These aren't a lot of data points, so I don't know how strong and significant those correlations are. Probably not very strong, as it includes only 13 data points. Moreover, they don't include South Korea, which has seen massive decline in fertility. Also note that the chart you include shows two graphs with different y axis scale which makes the fertility in the present look higher than if the scale was the same. Which is somewhat misleading.
You also say that the relationship between fertility and GDP is U shaped, but it rather appears only L shaped, with much more population weight on the left side, which is bad.
I would also highlight that the opportunity cost theory is usually a bit more sophisticated than presented here. The theory is that women tend to determine the decision of whether to have children and prefer to raise them themselves, and that they tend to prefer men with higher income than themselves. So if the woman earns significantly less than the man, her opportunity cost for having children instead of a career is small, because the man is the main breadwinner. If the income of the woman is the same or higher than of her partner, her opportunity cost of having children is high.
This theory says fertility isn't so much about absolute income, but about relative income between men and women. It explains why more gender egalitarian countries have lower fertility rates: Because the income of men and women is more similar due to women having careers. It also predicts that any possible positive relationship between high percentile IQ and fertility is determined by couples where the man has a higher IQ than the woman, but not the other way round -- because the latter case would likely mean that the woman is the main breadwinner, in which case she would be less likely to have children.
Is it still true that “more gender egalitarian countries have lower fertility rates” if you only include industrialized / wealthy countries? Thinking off the top of my head, some of the least gender egalitarian OECD countries, South Korea and Japan, also have some of the lowest fertility rates.
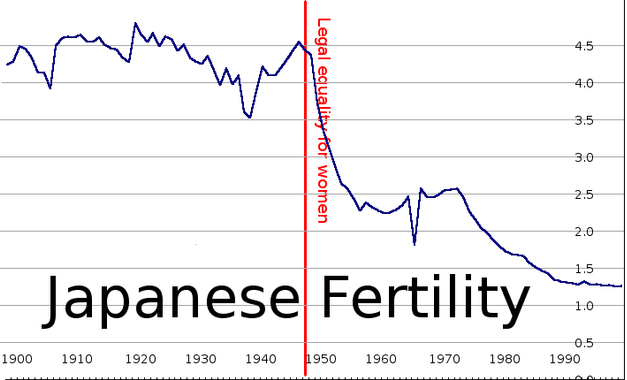
That chart doesn't prove much because there were a ton of confounding variables. The late 1940s were an extremely strange time for Japan due to multiple years of near famine, American occupation, new constitution, total reorganization of its industrial economy, etc., as well as the beginning of 4 decades of extreme economic growth, which is associated with lower fertility. Wikipedia even says that the "Western practice of 'dating' spread" implying it was not a thing before. All this had to have moved fertility in one direction or the other.
The entirety of Japanese society, government, politics, economy, etc, changed dramatically beginning in the late 1940’s, in a rather sudden way largely due to the influence of a foreign power. Thus I think that the fact that formal legal equality for women in Japan began in the late 40’s, and Japan’s fertility rate decline also began in the late 40’s, provides extremely little information on the relationship between gender equality and fertility in developed countries. Edit: Thomas Kwa already said basically the same thing, I just didn’t see his comment when I wrote mine.
At least on a country level, the correlation between IQ and fertility is strongly negative:
Worth noting that, within countries, this varies by culture. I don't have the graph on hand, but, for males, the fertility/IQ slope inverts depending on American political affiliation[1]. It's negative for women either way, unfortunately, but the slope is a lot flatter if they're Republican, to the point where I'd expect the positive correlation for men to cancel it out and yield a positive overall coefficient.
I would expect similar splits within other countries, and within America along other axes. For example, some religious groups and regional subcultures would probably demonstrate a positive IQ/fertility curve that dominates political affiliation.
Moreover, they don't include South Korea, which has seen massive decline in fertility
South Korea has started to go back up. I think "let's be the ones who show up to the future, whatever it takes" is a really romantic idea, and apparently some proportion of Koreans do too. A massive selection effect for romanticism may not be the primary effect of this bottleneck, but it does feel like a silver lining.
- ^
Intuitively, smarter people are more agentic, and thus better at putting their stated values into practice. A clever Republican will find ways to make pro-natalism work, and likewise a clever Democrat will find ways to avoid unplanned pregnancies. Your reasoning on breadwinners also tracks with this data, though.
Another important factor is the ever increasing school attendance. Hundred years ago, if you attended school until you were 18, you were considered highly educated. Today, you are considered too stupid to be allowed working at half of the jobs unless you have some kind of university. Starting you family in your 20s vs in your 30s results in a different family size. You have less time to raise kids. Your parents are more likely to be dead or otherwise unable to help you take care of the kids.
Feminism was supposed to give women a choice, but instead it turned into shaming motherhood. (In my country, "domestic wife" is literally used as a slur by feminists.) According to the cultural narrative, a woman who chooses to have kids and stay at home, is a loser. And if she decides to have both a family and a career, she is supposed to start the career first, even if from certain perspective that makes less sense -- if you have a career and you enjoy it, then starting a family means giving it up. (And if you don't enjoy your career, then why was it so important to have it?) On the other hand, if you have kids first, there is plenty of time for the career after they grow up and leave home, and then you never need to give up a successful career once it started. Or you can change your mind and choose to have more kids.
Basically, people are told that they have enough time to have kids later. And it's... kinda true... but it also changes how many kids they will have.
"Hundred years ago, if you attended school until you were 18, you were considered highly educated. Today, you are considered too stupid to be allowed working at half of the jobs unless you have some kind of university."
You just made me realize how big of an impact university expectations are on fertility twofold. It's obvious that if people are supposed to be 22 now before starting "real adult life", instead of 18, that will affect fertility rates by virtue of being less time to get situated and a shorter fertility window. However, there's a not so obvious double whammy, in that your children will also now be dependents for 4 years longer too! So instead of 18-40 year olds thinking, "i have 22 years to have kids that will just need to make it to 18", we now have to think "i have 18 years to have kids that will need to make it to 22." Timeframe shortened ~20%, dependency burden also increased ~20%.
To me the most important graph is the one that shows both mothers and fathers started spending much more time on child-care in the 90s. What the heck happened? Did children suddenly become that much more difficult to manage? If kids really consume that much time and effort, it's no wonder that people don't want to have kids - it's too much damn work!
My guess is the largest contributor is the cultural shift to expecting much more involved parenting (example: the various areas where parents had CPS called on them for letting their kids do what the parents were allowed to do independently as kids)
This is a great post. I knew that at the top end of the income distribution in the US people have more kids, but didn't understand how robust the relationship seems to be.
I think the standard evbio explanation here would ride on status -- people at the top of the tribe can afford to expend more resources for kids, and also have more access to opportunities to have kids. That would predict that we wouldn't see a radical change as everyone got more rich -- the curve would slide right and the top end of the distribution would have more kids but not necessarily everyone else.
But the gdp per capita graphs I think are evidence against that view. It looks like the curve is a lot flatter than when fertility is rising than when it's dropping, but if this holds into the future I really don't worry too much. We're on the cusp of all getting a lot richer, or else AI will kill us all anyway.
High income households have access to the world’s best leisure opportunities, yet they still invest more time in child-rearing than lower income households.
I doubt they invest more time. They have money to pay for more help with childcare. And I think this is the critical difference.
Time spent on care per child has skyrocketed in recent decades. I think that's one major factor driving down fertility: having kids is a bigger PITA every year.
Thinking of costs solely terms of money is a mistake. The time investment is critical.
This is why I'm unconcerned with low fertility if we get AI progress and don't die from it: AI is going to be great at childcare. Even current LLMs have the cognitive capacity to be good tutors and playmates.
Time spent on care per child could be an effect of decreasing fertility instead of a cause. The fewer children you have, the more time you can spend on each one.
It could be but that's clearly not the whole deal. Societal standards for childcare have shifted dramatically. That could be driven by people having fewer children and also causing it, in a vicious cycle.
I don't know if there's data available to answer this question, but it'd be interesting to know if the relatively small middle class that existed prior to the 20th century also saw lower fertility than their lower and higher class peers. And in that case maybe falling fertility is a middle class phenomenon that ends when people exit the middle class either by making enough to no longer be economically middle class or by making little enough money that they cannot aspire to middle class dreams.
Here's what Claude has to say:
There is some evidence that a similar fertility pattern existed in the past when the middle class was relatively smaller, particularly in the 19th century, but the data is more limited and the trends are not as clear-cut as in modern times.
In the 18th and 19th centuries, fertility rates tended to be higher among the aristocracy and wealthy classes, as well as among the poorest segments of society. The emerging middle class, which consisted of merchants, professionals, and skilled artisans, often exhibited lower fertility rates.
Here are some examples and observations from historical studies:
- In England and Wales, during the late 18th and early 19th centuries, fertility rates were highest among the landed aristocracy and gentry, followed by the urban poor. The middle classes, such as merchants and professionals, had lower fertility rates.
- In France, during the 19th century, fertility rates were lower among the urban middle classes than among the nobility and peasantry.
- In the United States, during the late 19th century, fertility rates were higher among the wealthy and poor, while the emerging urban middle class had lower fertility rates.
- However, it's important to note that fertility patterns were influenced by a complex interplay of factors, including cultural norms, access to contraception, and economic conditions.
While the data from the 18th and 19th centuries is less comprehensive and more subject to regional variations, there is evidence that the middle classes, particularly in urban areas, were at the forefront of the fertility transition, with lower fertility rates than the wealthiest and poorest segments of society. This pattern is consistent with the idea that the marginal value of additional labor played a role in fertility decisions, although other factors were also at play.
I asked Claude for sources on the above claims. Number 2 might be hallucinated, but all the others I found quickly with Google:
- Wrigley, E. A., Davies, R. S., Oeppen, J. E., & Schofield, R. S. (1997). English population history from family reconstitution 1580-1837. Cambridge University Press. This study analyzed parish records and found that in England, fertility was highest among the landed gentry and aristocracy in the 18th and early 19th centuries.
- Livi-Bacci, M. (1986). Social-group fertility differential in France: An economic analysis. Population Studies, 40(2), 223-243. This paper examined data from the 1851 census in France and found lower fertility among the urban middle classes compared to the nobility and peasantry.
- Haines, M. R. (1992). The New England Family Study: A study of fertility differentials among Pre-Industrial Urban and Rural Populations. Journal of Family History, 17(1), 17-35. This study analyzed fertility patterns in New England in the late 18th and early 19th centuries, showing lower fertility among the urban middle classes.
- Hacker, J. D. (2003). Rethinking the "early" fertility decline in the United States: Integration of old evidence and new models. Social Science History, 27(4), 545-586. This paper argues that fertility decline in the United States began earlier than previously thought, with the urban middle classes leading the trend in the late 19th century.
- Livi-Bacci, M. (1977). A history of Italian fertility during the last two centuries. Princeton University Press. This book examines fertility patterns in Italy and found that the middle classes were often at the forefront of fertility decline in the 19th century.
ta.
Wow, what interests me and surprises me about this graph is the big bump that peaks in the 50's but begins in the 40's. Baby Boom indeed! I had always thought that the Baby Boom was a return to trend, i.e. people had less kids during the war and then compensated by having more kids after. But it seems that they overcompensated and totally reversed the trend that had been ongoing for decades prior to the war! So now I'm confused about what was going on, and more hopeful that these trends might be reversible.
Very good article. I've long said that the U-curve of fertility didn't get enough coverage.
The increases in labor productivity and leisure opportunities that make economic growth so important also siphon resources away from the future contributors to that growth.
I feel like this amounts to a subcase of the superstimulus problem. You can argue whether a medieval peasant would spend all day eating nacho cheese Doritos all day, but modern humans (generally) don't, and I'd argue that some combination of biological and cultural evolution is responsible for making us get sick of things that are excessively indulgent.
This could be said to be a factor in the U-curve, too. More disciplined, agentic, and intelligent people both have an easier time earning money and are more inclined to reject superstimuli.
This means that broad pro-growth policies like housing deregulation can raise birthrates even without specific subsidies for parents or childcare specific reforms, though the two will work better together.
I would argue the contrary. One of the core benefits of being ultra-rich, at least in America, is being able to buy yourself freedom of association. A gated community where your kids can play outside until 10 like it's still the 1990's. A neighborhood that can be the 'village' that helps with raising children. A school where you don't really have to worry that much about what might happen while you're at work.
A lot of the U-curve, in my estimation, comes from the fact that middle-class people are conscientious enough to care about those things but not wealthy enough to afford to provide them for their hypothetical children. "I couldn't raise a child in this neighborhood" is something I've heard a lot.
Birth rates in the developed world are below replacement levels and global fertility is not far behind. Sub-replacement fertility leads to exponentially decreasing population. Our best models of economic growth suggest that a shrinking population causes economic growth and technological progress to stop and humanity to stagnate into extinction.
One theory of fertility decline says it’s all about opportunity costs, especially for women. Rising labor productivity and expanded career opportunities for potential parents make each hour of their time and each forgone career path much more valuable. Higher income potential also makes it cheaper for parents to gain utility by using financial resources to improve their children’s quality of life compared to investing time in having more kids. Simultaneously, economic growth raises the returns to these financial investments in quality (e.g education).
In addition to higher incomes, people today have more diverse and exciting options for leisure. DINKs can go to Trader Joes and workout classes on the weekend, play video games, watch Netflix, and go on international vacations.
These rising opportunity costs accumulate into the large and pervasive declines in fertility that we see in the data.
If this explanation is correct, it puts a double bind on the case for economic growth. Unless AI upends the million-year old relationship between population and technological progress just in time, progress seems self defeating. The increases in labor productivity and leisure opportunities that make economic growth so important also siphon resources away from the future contributors to that growth. Empirically, the opportunity cost of having kids has grown large enough to bring fertility well below replacement levels all around the world. The opportunity cost explanation suggests we have to pick between high incomes and sustainable fertility.
Luckily, this explanation is not correct. At least not entirely. There are several observations that the opportunity cost theory cannot explain without clarification. Across and within countries today, the relationship between income and fertility is positive or U-shaped. Further economic growth can raise everyone’s incomes to the upward sloping part of the relationship and begin a 2nd demographic transition.
Micro Data
Above a $200k a year, fertility is increasing in household income.
** Update **
I replicated this graph from more recent ACS data (2018-2022) and also weighted each point by population to give a sense of the size of each of these income brackets
This U-shaped relationship holds up in multiple data sources with different measures of fertility. The households in the top percentiles of income stand to lose far more future wages from having children, but they have ~20 more children per hundred households than the middle income percentiles.
This isn’t exactly inconsistent with opportunity cost but it requires some explanation. The number of dollars that households are giving up by having children is increasing in household income, but as you get more and more dollars, each one is worth less. Going from making say $75 to $150 dollars an hour pushes you to work more hours, but if you go from $150 to $500, you might be happy to work half as many hours for more money and spend the time on other things, like starting a family. So while the dollar opportunity cost of having kids is always increasing in household income, the utility opportunity cost is not.
The positively sloped section of the relationship between income and fertility isn’t just spurious correlation either. Random shocks to wealth, like lottery winnings, also increase fertility.
This rules out the DINK leisure time explanation for low fertility too. High income households have access to the world’s best leisure opportunities, yet they still invest more time in child-rearing than lower income households. The time investment is even more upward sloping than the graph above shows because higher income parents spend more time on child care per-kid.
Source
I think the explanation here is that childcare is a complement to many leisure activities rather than a substitute. Experiencing the joys and wonders of the world is better when you can experience them with and through your children.
It used to be that the wealthiest and highest educated women had the lowest fertility, but this trend is reversing.
Since this U-shaped relationship was not present in past data, it’s more likely that this effect is due to passing an absolute amount of income, rather than an effect of being in the top 1% of income whatever it may be. Economic growth can raise everyone’s incomes and push more people past this threshold on to the upward sloping part of the income-fertility curve.
Macro Data
This U-shaped pattern shows up in macro cross-country comparisons too. Earlier in the 20th century when most high-income countries were still going through their demographic transition, the relationship between GDP per capita and fertility was negative. The world was on the left side of the U-shaped curve. Today, all of these countries are much wealthier and the correlation is now positive: higher income countries also have higher fertility.
Source
It used to be that countries with the highest female labor force participation had the lowest fertility rates, now it’s the opposite.
Source
Across all countries today, there is a U-shaped relationship between fertility and GDP per capita.
Source: Ask GPT to combine this, this, and this
The correlation between fertility and GDP growth rates has also reversed, especially in high income countries.
Again we see evidence that getting past a threshold level of income or GDP per capita flips the sign on the relationship between income and fertility. The tradeoff between economic growth and high birthrates in long-term historical data and among currently developing countries is well established. But this negative relationship need not hold over all levels of income and indeed does not.
This reversal of the income-fertility relationship breaks the double bind that the opportunity cost theory seemed to place on progress.
Mechanism
What is causing the reversal of cross-country and within-country income-fertility relationships?
We’re finally hitting the downward sloping part of the labor supply curve. Time dedicated to labor is not forever increasing in labor productivity. Once you make enough money to comfortably provide for yourself and your family, many are happy to work less and raise more children. Economic growth can raise everyone’s income above this level. This is why Keynes predicted that the workweek would only be 15 hours long by 2030, and while we’re not quite there yet, working hours have been trending down for decades.
Fertility decline is multi-causal and overdetermined, so there are certainly other mechanisms driving both directions of the U-shaped fertility curve. Pro-natal culture is an important mechanism for fertility that I’ve ignored. Strict regulations and subsequent price rises for housing, childcare, and education are important contributors to fertility decline and can blunt or delay the U-shaped reversal.
The opportunity cost of raising children is clearly an important factor in parent’s fertility decisions and it is essential for modeling the industrial demographic transition. When economists were first studying this problem, income and fertility had a universally negative relationship. As incomes around the world have continued to increase, this negative relationship is beginning to break down. The women, men, and nations with the highest incomes and the most opportunities for leisure have higher fertility than the ones in the middle.
This is great news for progress. Rather than facing a tough tradeoff between high income and above-replacement fertility, we just need enough growth to get more people over the opportunity cost hump so that they’ll start having more kids as incomes increase.
This means that broad pro-growth policies like housing deregulation can raise birthrates even without specific subsidies for parents or childcare specific reforms, though the two will work better together. Falling fertility is one of the world’s most pressing challenges but we can grow our way out of it!