The largest source of publicly available genetic sequencing data is
the Sequence
Read Archive (SRA), a joint project of the US (
NCBI),
Europe (
EBI),
and Japan (
DDBJ).
Most relevant funding agencies and journals require sequencing
data to be deposited in the SRA. I was curious how quickly it has
been growing, so I ran some queries.
The metadata for the SRA is available in
the cloud and we can access it through BigQuery. I ran:
  SELECT EXTRACT(YEAR from releasedate),
         EXTRACT(MONTH from releasedate),
         SUM(mbases),
         SUM(mbytes)
    FROM `nih-sra-datastore.sra.metadata`
GROUP BY EXTRACT(YEAR from releasedate),
         EXTRACT(MONTH from releasedate)
This gave me how much new data there was each month, in terms of both
genetic bases and (compressed) bytes on disk.
Note the logarithmic y-axis.
This is reminiscent of another chart, the cost to sequence 1M bases:
(This is a pretty amazing chart, with the huge drop around 2008 coming
from NGS
Sequencing)
We could combine these, to get a rough estimate for how much
money is being spent to sequence the data going into the SRA, but to
do this we need to know how long a delay there is between sequencing
and releasing: if it cost $400/Mb in 2007-10, $100/Mb in 2008-01, and
$15/MB in 2008-04, then which cost should we use for interpreting data
released in 2008-06? Here's a plot showing models 0-, 6-, 12-, and
24-month delays:
It looks like maybe ~9m is the initial delay, and with costs changing
more slowly in recent years it doesn't matter much for more recent
data.
Looking just at the last five years, after it has leveled out some, it
looks like a steady ~1.2e16 bases annually:
The largest source of publicly available genetic sequencing data is the Sequence Read Archive (SRA), a joint project of the US ( NCBI), Europe ( EBI), and Japan ( DDBJ). Most relevant funding agencies and journals require sequencing data to be deposited in the SRA. I was curious how quickly it has been growing, so I ran some queries.
The metadata for the SRA is available in the cloud and we can access it through BigQuery. I ran:
SELECT EXTRACT(YEAR from releasedate), EXTRACT(MONTH from releasedate), SUM(mbases), SUM(mbytes) FROM `nih-sra-datastore.sra.metadata` GROUP BY EXTRACT(YEAR from releasedate), EXTRACT(MONTH from releasedate)This gave me how much new data there was each month, in terms of both genetic bases and (compressed) bytes on disk.
Note the logarithmic y-axis.
This is reminiscent of another chart, the cost to sequence 1M bases:
(This is a pretty amazing chart, with the huge drop around 2008 coming from NGS Sequencing)
We could combine these, to get a rough estimate for how much money is being spent to sequence the data going into the SRA, but to do this we need to know how long a delay there is between sequencing and releasing: if it cost $400/Mb in 2007-10, $100/Mb in 2008-01, and $15/MB in 2008-04, then which cost should we use for interpreting data released in 2008-06? Here's a plot showing models 0-, 6-, 12-, and 24-month delays:
It looks like maybe ~9m is the initial delay, and with costs changing more slowly in recent years it doesn't matter much for more recent data.
Looking just at the last five years, after it has leveled out some, it looks like a steady ~1.2e16 bases annually: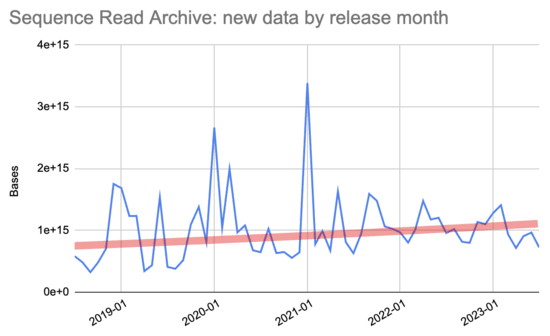
Comment via: facebook, mastodon