When people say that we shouldn’t base our life decisions on probabilities, they mean (to mean) that we should do max min over some credal set of probability distributions. We don’t have the math to get the details or justification right yet, but we will someday and that heuristic will make sense. The “adversary” that justifies the min operation will be something like your mind / memetically optimized arguments trying to fool you (plus average case = worst case against the universal distribution). Possibly the whole thing will have an elegant, fully Bayesian formulation, but it won’t be easy to discover it in that formulation from scratch. The point is, this type of critique cannot be properly banished on the meta-level alone.
In the context of this specific discussion, it’s valid to point out that a certain amount of hedging against unknown unknowns is wise. But it’s still better to build a probabilistic model (squeezing the credal set along some dimension) then not to build a model. Therefore the AI 2027 authors are much less wrong.
It isn't the authors' fault, but LLMs progress is so rapid that this kind of extensive work can hardly keep up with the release of new models providing new data. It's kind of frustrating. I hope to see Claude Sonnet 4.5, Claude Opus 4.5, Gemini 3 Pro, and ChatGPT 5.2T in the plots of the upcoming update.
Me too. It's METR who has yet to reveal anything aside from evidence extracted by Jurkovic about the models aside from C. Sonnet 4.5 (and GPT-5.1 Codex Max, but you didn't mention it; C. Sonnet 4.5 was never SOTA to begin with and could be unusable for the graph. GPT-5.1 Codex Max had someone add the data point to the AI-2027 graph and Kokotajlo notice the likely return of the 7 month doubling trend) But I doubt that "this kind of extensive work can hardly keep up with the release of new models providing new data", since an update of parameters would likely require mere days, if not minutes, of thinking per data point. See, e.g. Greenblatt's quick take about the GPT-5-related forecast and my two comments there, or my post on a worrisome trend which could have been invalidated by new models.
You're right. Sonnet 4.5 was impressive at launch but the focus of AI 2027 is on coding oriented models.
I'm curious about the details of your model when it comes to long-time horizon planning:
There is often a recursive structure to doing tasks that take months to years, of which a simplified version might look like:
- Decompose the task into substasks
- Attempt to solve a subtask
- If you succeed, go on to the next subtask
- If you fail, either try again, i.e. (2), or revisit your overall plan, i.e. (1)
The skills needed to execute this loop well include:
- Making and revising plans
- Intuitions for promising directions
- Task decomposition
- Noticing and correcting mistakes
Let’s call this bucket of skills long-horizon agency skills. It seems like for long enough tasks, these are the primary skills determining success, and importantly they are applied recursively many times. Such that, improving at long-horizon tasks is mostly loaded on improving at long-horizon agency, while improving at short-horizon tasks is mostly loaded on improving at specialized knowledge.
I do understand that these are more of the justifications for why you might extrapolate data in the way that you're doing yet I find myself a bit concerned with the lack of justification for this (in the post). This might just be because of infohazard reasons in which case, fair enough.
For example, I feel that this definition above applies to something like a bacterial colony developing antibiotic resistance:
- It can make plans that maintains phenotypic diversity through bet-hedging—multiple strategies held in parallel. When antibiotics hit, resistant variants proliferate while sensitive variants die off. The population "revises its plan" through differential survival.
- It essentially develops intuitions of where to go, evolved response patterns encode which resistance mechanisms work against which threats. These are "intuitions" (read search strategies and priors) optimized over billions of years.
- We have task decomposition since subpopulations differentiate into functional roles—resistance expressers who bear metabolic costs, sensitive free-riders who benefit from herd protection, dormant persisters who survive through inactivity, and "scout" cells that test environmental conditions.
- We also have error correction since failed strategies get pruned through death. Successful strategies get amplified through reproduction.
Now the above examples is obviously not the thing that you're trying to talk about. The point I'm trying to make is that your planning definition applies to a bacteria colony and that it therefore is not specific enough?
In order to differentiate between a bacterial colony and a human there are a set of specific properties that I feel need more discussion to make the model rigorous:
- What about self representations (e.g boundaries) as computational shortcuts to model your action policies as consistent in your environment?
- What about task compositionality (specialized tasks combining)?
- What about the challenges of online learning and the specific computational laws that show up there?
- What about the specialized learning apparatus that we have in our brains?
Maybe a bacterial colony and humans are on the same planning spectrum and there's some sort of search based version of the bitter lesson that says that "compute is all you need" yet it feels like there are phase transitions in between bacterial colonies and humans and that this is not a continous model. Does compute give you self representations? Does compute enable you to do online learning? Does compute + search give you the planning apparatus and memory bank that the brain has?
How do you know that 12+ hours tasks don't require a set of representations that are not within what your planning model is based on? How do you know that this is not true for 48+ hours tasks?
To be clear, I applaude the effort of trying to forecast the future and if you can convince me that I'm wrong here it will definetely shorten my timelines. It makes sense to try the most obvious thing first and assuming a linear relationship seems like the most obvious thing. (yet I still have the nagging suspicion that the basis of your model is wrong as there are probably hidden phase transitions between going from a bacterial colony in planning function and a human.)
In the time horizon extension method, we started at 1.1 in present day, which is roughly the same multiplier we ended up with above when comparing to GPT-2 or essentially no AI assistance.
As far as I understood the buggy model, an AI assistant's multiplier of AI R&D speed is 1 until it suddenly becomes capable of writing code usable for research (e.g. in an experiment whose code was entirely written by Claude) and the effect of AI assistance starts gradually increasing from 1 to SC level. How plausible is this revival of the old model?
On the other hand, one could make a case for long horizons being superexponential since a certain level. A human who works on a complex codebase for a long time is able to keep in mind many details at once (e.g. trace the origins of files sent and find out their format) or quickly look them up without degrading performance on the main task. An AI, on the other hand, would do things like coming up with names for methods that already exist in the codebase unless the names end up in the AI's attention span.
P.S. I suspect that the evidence mentioned in Footnote 17 didn't include GPT-5.1 Codex Max which would place the time horizons on the longer trend (with the exception of the new models which have yet to be evaluated)
EDIT: The new models could turn out to be a breakthrough returning us to the faster trend, as suggested by evidence obtained unofficially by Nikola Jurkovic.
Introduction
In June, a Substack/LessWrong/EA Forum user named titotal wrote “A deep critique of AI 2027’s bad timeline models”. Our original model that they were critiquing can be found here, with a brief overview below.[1]
In a nutshell, we disagree with most of titotal’s criticisms. While they pointed out a few mistakes, for which we are grateful, on the whole we think the problems that they pointed out do not add up to the model being “bad.” In this post we will explain why.
While we initially responded via a comment, we wanted to make a more in-depth response. We apologize for the delay; we are planning to release a new timelines+takeoff model soon and thus thought this was a good time to polish and then publish our thoughts.
We thank titotal for the time and effort they put into the critique. We gave them $500 for their efforts for pointing out some bugs and mistakes. The primary correction we made to our model based on titotal’s critique would have pushed back the median Superhuman Coder arrival time by about 9 months. Though our upcoming model release represents a significant restructuring of the old model, some considerations raised by titotal were still usefully applicable to its development.
Below we discuss our responses to titotal’s most important criticisms of a few forms:
Brief overview of our AI 2027 timelines model
Our model was released in April 2025. Quoting from our writeup:
We forecast when the leading AGI company will internally develop a superhuman coder (SC): an AI system that can do any coding tasks that the best AGI company engineer does, while being much faster and cheaper.
We first show Method 1: time-horizon-extension, a relatively simple model which forecasts when SC will arrive by extending the trend established by METR’s report of AIs accomplishing tasks that take humans increasing amounts of time.
We then present Method 2: benchmarks-and-gaps, a more complex model starting from a forecast saturation of an AI R&D benchmark (RE-Bench), and then how long it will take to go from that system to one that can handle real-world tasks at the best AGI company.
And here is our original results table:
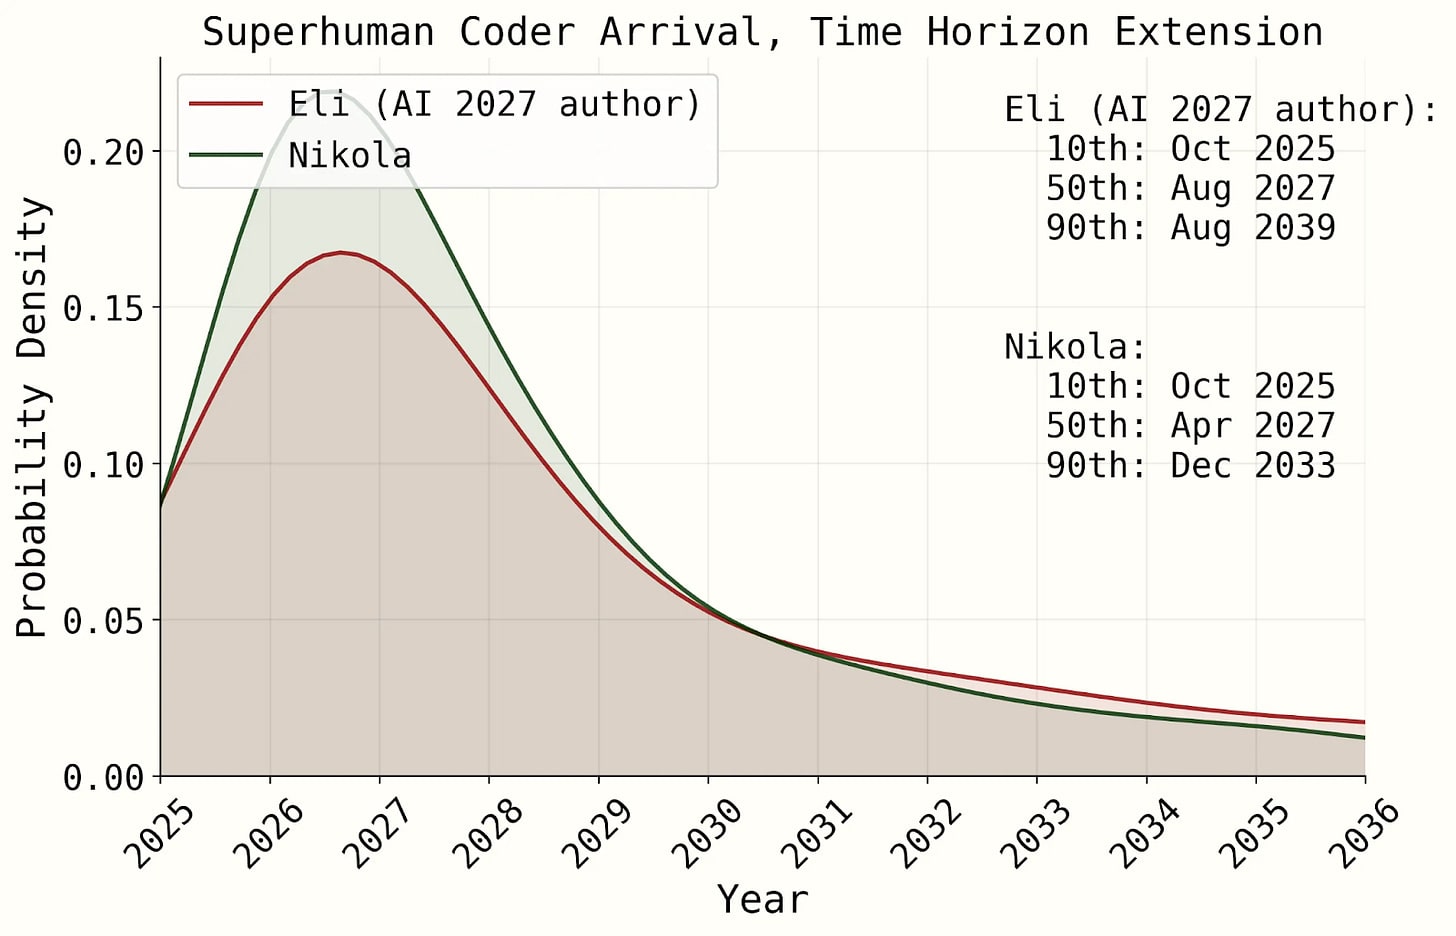
And the headline figure:
And here’s the figure for the time horizon extension forecast, which we will focus on in this post (as titotal also did, primarily):
What types of futurism are useful?
Summary
Below we summarize our responses to titotal’s primary critiques about our model’s style of futurism not being decision-relevant.
Critique: People shouldn’t base their life decisions on models without strong conceptual justifications or empirical validation.
Response: The future of AI is inherently more uncertain and less well-understood than the phenomena physicists model. But the alternative to modeling is vibes, and we think that vibes+modeling is better than just vibes alone. On the first page of AI 2027, in the “Why is this valuable?” box, we explained and justified our project by analogy to Taiwan invasion wargaming: even though we can’t hope to precisely predict how a future war would play out, we can still try, and in doing so, be more prepared and less surprised by what happens.
Critique: AI 2027’s timelines model is “bad” (as in the title of titotal’s post)
Response: We agree that our original model had important limitations and a few outright errors. The net effect of addressing all the bugs and areas for improvement pointed out by titotal and Peter Johnson pushed the SC median with Eli’s parameters back from Aug 2027 to Nov 2029 – a substantial change, but one that would have left significant probability mass by end of 2027 (shifting from ~55% to ~30%). This sort of thing is normal. AI progress is inherently hard to predict and the literature on it is nascent. If we want the literature to improve, we have to contribute to it, which is what we are doing.
Decision-making without strong conceptual or empirical support
titotal’s critique: People shouldn’t base their life decisions on models without strong conceptual justifications or empirical validation.
Sample quotes:
Our response: We never said that people should trust our model completely; we incorporate other sources of evidence ourselves. The future of AI is inherently more uncertain and less well-understood than the phenomena physicists model. But the alternative to modeling is vibes, and we think that vibes+modeling is better than just vibes alone. And we continue to think that, while imperfect, our original timelines model is still one of the best out there. Moreover, we felt it was important to give readers of AI 2027 some sense of why we thought 2027 was a plausible arrival year for AGI; hence, we felt it was important to share some of the modelling we had been doing. Finally, there is a small but growing literature on AI timelines and takeoff modelling, and we think it is good to contribute to it, and we plan to continue to do so. In this way, the models can become more rigorous and accurate over time. While there are many factors we haven’t taken into account, this is true for basically all useful models, and we think it would be a shame if no one published AI timelines predictions because they were intimidated by the number of factors that would need to be taken into account.
On the first page of AI 2027, in the “Why is this valuable?” box, we explained and justified our project by analogy to Taiwan invasion wargaming: even though we can’t hope to precisely predict how a future war would play out, we can still try, and in doing so, be more prepared and less surprised by what happens. And yes, absolutely, the US and Chinese militaries should base decisions on what happens in their wargames and simulations.
We also advise looking into plans that are robust to extreme uncertainty about how AI actually goes, and avoid actions that could blow up in your face if you turn out to be badly wrong.[3] In our view, given evidence such as modeling efforts like ours, expert surveys, company employees’ views, etc., this includes making plans that are robust to short AGI timelines–and in particular, plans that are robust to scenarios like AI 2027.
Details regarding why our model should inform decisions
Written in Eli’s first person voice
Whether implicitly or explicitly, we cannot avoid having to make decisions that depend on AGI timelines. For example, do you go to law school or not? It’s a very high upfront cost that pays off over the rest of your career. If AGI is coming soon, it makes less sense to go to law school than if AGI is far away. You can explicitly guess at AGI timelines probabilities and incorporate that guess into your decision (“I think there’s something like a 10% chance it happens while I’m in law school, in which case I’d regret going; however, if it happens after law school then I think I’d still be glad I went and the chance is low enough that overall I think I should go”)… or you can refuse to put numbers on it and say something like “I should ignore speculative considerations such as AGI” (which amounts to implicitly assuming AGI is far away) or “Given future uncertainty, I should avoid costly commitments” (which amounts to implicitly assuming AGI could well be nigh).
The data available today unfortunately cannot provide nearly the same level of certainty on AGI timelines as physics models typically provide about physics questions, so the decisions we make today must necessarily rely on more uncertain predictions.
Given that, as far as I can tell, these are the options for evidence that we can base our decision-making on:
I incorporate AGI timelines forecasts into my decision-making primarily by considering explicit quantitative models, and intuitive adjustments on top of those models (i.e. Options 1 and 2).
I’m a fan of intuition-based quantitative forecasts in some cases (i.e. Option 3). For example, the decision might not be important enough to spend the time to create a quantitative model. Or it might be hard to decompose the decision well enough to create even an informative toy model. I’m sympathetic to preferring option 3 for AGI timelines. But as I’ve thought more about the topic and we’ve gotten better trends to extrapolate to high capabilities, I’ve found that my new explicit models seem far superior to my previous estimates, which were closer to vibes-only. I think as we get closer to AGI and thus can create better models, Option 3 will continue to look worse and worse compared to Options 1 and 2.
I think that considering AGI timelines estimates but not making quantitative forecasts, but mostly in quick decisions (Option 4). I think it’s usually helpful to force yourself to “make up numbers” i.e. pull a number from one’s intuition rather than an explicit model (see also calibration training). But if someone doesn’t have quantitative timelines forecasts but has thought a bunch qualitatively about timelines and about how it should affect decisions, I think it’s still a big step relative to Option 5 (not thinking about AGI timelines).
In sum, I think that for very important forecasts, including AGI timelines, it’s generally quite useful to consider quantitative models, even if they are flawed. Not because that will get us an amazing answer, but because it’s better than the other options available.
Regarding taking actions that are robust to extreme uncertainty, I generally agree! But I think it’s very hard to interpret this guidance on its own. If extreme uncertainty means predicting equal probability of AGI for each of the next 1000 years, that would imply very different actions than extreme uncertainty implying that you should give at least a little weight to the timelines of executives and researchers at AGI companies (which are often quite short). My view is that being willing to discuss quantitative probabilities helps our ability to act under extreme uncertainty, rather than hurts it.
For many people, even though we cannot be confident that AGI is coming soon, we think that AI 2027 should be an update towards “maybe it could happen soon.” From our perspective, it is important to not be confident that AGI won’t come soon, or else risk us getting caught off guard.
More reasons why we wanted to publish our model, besides it being reasonable for people to base decisions off of:
Was our timelines model “bad”?
titotal’s critique: The AI 2027 timelines model was “bad” (as in the title of titotal’s post)
Our response: We agree that our original model had important limitations and a few outright errors. We expected as much, which is why we advertised a bounty program to pay people to critique our model. We ended up paying out $500 each to titotal and Peter Johnson as a result. The net effect of addressing all the bugs and areas for improvement pointed out by titotal and Peter (plus a relatively small effect from a few improvements/fixes we thought of on our own in the month after release), in the time horizon extension model, was to push the SC median with Eli’s parameters back from Aug 2027 to Nov 2029 – a substantial change, but one that would have left significant probability mass by end of 2027 (shifting from ~55% to ~30%). If isolating direct fixes to mistakes pointed out by titotal, we get a 9 month shift (the only change is fixing a bug in AI R&D speedup interpolation), though their feedback influenced our further modeling in less direct ways.
This sort of thing is normal. For example, (Daniel writes) Ted Sanders, a forecaster at OpenAI who I respect, wrote this forecast/analysis which I very much disagreed with. Digging into the details, I found that it involved a median estimate for the inference compute cost of transformative AI that was 8-10 orders of magnitude bigger than GPT-4. I thought this was way off and said so in the comments & we had a productive and pleasant exchange about it. To give another example, it seems that Davidson’s Full Takeoff Model, which inspired many of our modeling choices, was off by a lot in their estimate of some key parameters, such that fixing the error brings the model’s Transofrmative AI median down from 2040ish to 2030ish.
AI progress is inherently hard to predict and the literature on it is nascent. If we want the literature to improve, we have to contribute to it, which is what we are doing.
Many future trajectories
Titotal’s critique: There are many future trajectories/“stories” that fit the past time horizon data well (link).
Our response: We agree with and like titotal’s section about how you can draw lots of different lines through the data and get different conclusions. We feel like that section would have been very at home on our own blog!
Predicting the future of AI is very hard. And very few people are even trying. Nevertheless, we think it’s important to try, and to write up your attempts. We think it’s valuable to have a serious, concrete scenario of how the future might go; we think having multiple such scenarios is even more valuable and we plan to continue writing such scenarios over the years.
In the hopes of encouraging other scenarios to be written, we ran a contest. Titotal did respond to our contest with “Slopworld” which is a concrete scenario forecast analogous to AI 2027, for which we commend him. We encourage people to go read it, it’s helpful for understanding the sort of future he expects, even though he doesn’t seem to stand by it as much as we stand by AI 2027–he specifically says it’s not a forecast.
Concrete criticisms of our model
Summary
We thank titotal for pointing out:
We disagree with their other criticisms, most importantly we stand by our choice to give subtantial weight to superexponential time horizon growth.
titotal’s critique: We put too much weight on superexponential time horizon growth, meaning that there is a faster-than-exponential relationship between log(effective compute)[5] and the METR time horizon trend. (link)
Our response: We agree with titotal that at the time we published, our thinking on this was underdeveloped and not presented particularly well. Now that we’ve thought about it more, we think we should have put more weight on superexponential time horizon growth than the 45% that we did originally, even though our upcoming models’ timelines are overall longer than our original one. A brief summary of our reasoning (you can read more below):
titotal’s critique: Our model backcasts poorly i.e. if you take our method and plug in times in the past, it poorly fits both (a) plausible AI R&D speedup trends (link) and (b) the observed time horizon data (link).[6]
Our response: This was largely due to a bug in the code, our bad. When we fix the bug, the AI R&D backcast looks much better.
The superexponential time horizon backcast also looks much better (though the exponential looks worse). But this isn’t really on purpose, we got lucky that it looks this good, since we didn’t test out how it backcasted before publishing the model.
We also think that backcasts, while an important exercise, should not be a be-all end-all, especially given that the METR time horizon backcast relies on a single noisily measured trend (that stitches together three benchmarks with differing properties).
Superexponential-in-effective-compute time horizon growth
This section was written by Eli, in the sense that the first person speaks for him.
Summary
We will discuss whether the 80% coding time horizon will be superexponential in log(effective compute).[7]
We agree with titotal that at the time we published, our thinking on this was underdeveloped and not presented particularly well. Now that we’ve thought about it more, we think we should have put more weight on superexponential time horizon growth than the 45% that we did originally, even though our upcoming models’ timelines are overall longer than our original one.
We argue time horizon growth should be superexponential in the case where a task's horizon length is defined as the time it takes humans to do the task (as it is in the original METR-HRS paper), rather than some more "intrinsic" metric of the difficulty of the task (like number of steps or subtasks) that some who disagree with us prefer.[8] Our definition also imposes a speed and compute-efficiency requirement for when an AI completing a task counts as success.
Here is our core reasoning:
Argument from eventual infinite or very large horizons: AIs much more generally capable than humans would have infinite time horizons, and reaching this point in finite effective compute requires superexponential time horizon growth. They would have infinite time horizons because they are definitionally better than humans at every horizon length. METR authors argued as much in their paper introducing METR-HRS.
Argument from generalizing long-horizon agency skills: Increasing time horizons from 1,000 to 2,000 years is more loaded on long-horizon agency skills than increasing them from 1 to 2 minutes. Since long-horizon agency tasks and subtasks are more correlated with each other than short-horizon tasks are, this points toward more sudden progress and thus faster doubling times at higher time horizons.
We do not think that every continuous AI capability metric will have superexponential/superlinear-in-log(effective compute) growth. Our views on METR-HRS are due to time horizons being defined relative to human baseliners. For example, our best guess is that the Epoch Capabilities Index will grow linearly in log(effective compute) (which is analogous to time horizon growing exponentially), though it may grow superlinearly in time due to AI R&D automation.[9]
More details below, including more details on the above as well as discussion of the apparent recent speedup in time horizon growth, the choice of superexponential functional form and parameters, and how changing the present time horizon should affect behavior.
Clarifying the notion of time horizons
We’ve found that some disagreements about time horizon growth stem from people not using the same definition of horizon lengths, and thus talking past one another. So in this section we clarify our conception of time horizons.
First, we explicitly impose both a speed requirement and a compute-efficiency requirement for an AI completing a task to count as success. Specifically, we require the AI to complete the task as quickly as the median human at the AGI project who does similar tasks,[10] and we require the AI to use a proportion of automation compute equal to the proportion of human coders working on the task at the AGI project. The METR paper does not set such speed and compute-efficiency thresholds, but we think this is important since AIs already sometimes accomplish tasks less efficiently than humans, and we expect this to become more important over time as AIs are better at translating more resources into better performance. These requirements should be roughly consistent with the METR data points to date.
Second, and more importantly, we've noticed different people having different implicit conceptions of what time horizons mean. One conception (the one we use) is human-relative and the other conception is about intrinsic task difficulty. According to the human-relative version, the horizon length of a task is the time it takes successful human baseliners to complete the task. According to the intrinsic-task-difficulty version, horizon length is trying to capture an objective notion of task difficulty, something akin to "how many steps it takes to complete the task" or "how many subtasks the overall task decomposes into". These two conceptions come apart, especially when considering harder tasks of longer horizon.
For example, assuming an AI would ever have an infinite time horizon strikes some people as strange, since, surely, however smart the AI is, there would always be tasks whose difficulty was out of reach. While that may be true according to an intrinsic-task-difficulty metric, this is less convincing for a human-relative metric. In order for an AI to have an infinite time horizon in the human-relative conception, it "simply" needs to be able to complete all tasks humans can do (at a high enough success rate, and at some speed and compute-efficiency threshold that depend on how long humans take to complete the task).
Our arguments and our upcoming model use the human-relative conception.[11] We also see the appeal of the intrinsic-task-difficulty conception, but (a) we currently haven't encountered a proposal that makes this precise (and especially not one that can be extrapolated to an interpretable, high capability threshold), and (b) the methodology METR is currently using to get time horizons may not match up well with an intrinsic-task-difficulty definition of horizon length (so this would decrease the relevance of past data and future data based on human baseliners).
Argument from eventually infinite time horizons
The authors of the METR-HRS paper write:[12]
We roughly agree. Eventually we will create an ASI agent that is vastly better than current human coders at essentially every coding task regardless of length or difficulty. This follows if you believe humans aren't near the limit of coding abilities. In particular, an ASI will have better long-horizon agency skills than humans (such as long-term planning, decomposing long tasks, and noticing and correcting mistakes).
Our best guess is that such an ASI will have an infinite time-horizon (again, where we interpret the horizon length of a task in a human-relative way). We hinted at this in the previous section, and here we briefly elaborate on our thinking.
As illustrated in the above figure, we think there are three possibilities for what the graph of success rate vs horizon length (i.e. time taken by humans) looks like for an AI with better long-horizon agency skills than humans:
We think (1) and (2) are substantially more likely than (3) for the human-relative conception of time horizons, though we still think (3) is a non-negigible possibility.
Implications: what does all this imply for the growth rate of time horizons? If an ASI does have an infinite time horizon, and if ASI is reached at a finite effective compute level, then (as the METR authors point out) time horizon must eventually reach a vertical asymptote. In particular, it should grow faster than exponentially at least as it approaches that critical level of log(effective compute). While it is conceivable that growth would be close-to-exponential up until we get close to that critical level of log(effective compute), our best guess is that there won't be such a strong phase transition, and that the superexponentiality will become noticeable earlier.
If an ASI has a finite (but extremely large) time horizon, then it’s more difficult to say whether growth would be superexponential. We give a few thoughts on this in a footnote.[14]
[Aside] Thought experiment regarding the time horizon of sped-up human coders
Consider as a thought experiment what horizon lengths would be achieved by the human coders themselves sped up 100x, which could be thought of as a version of an ASI (that’s likely at least somewhat less capable than an ASI).
If we assumed that coders had deterministic performance, then speeding them up could only make them achieve the tasks faster, leading to a success rate of 100% at every horizon length, and thus an infinite 80% time horizon.
But if we allow for some randomness, then occasionally the sped-up coders would not complete the tasks in time, because for example they happened to pursue very unlucky paths toward solving the task. Let’s call the probability that the sped-up coders achieve a specific task efficiently enough p.
What is the relationship between task horizon length and p? p seems quite high in the range of tasks that we observe. It’s unclear to me whether p is higher or lower at 5 months than at 5 seconds, and it’s unclear to me how the trend will continue. p might be higher at 5 months because there’s more time for randomness to “wash out” (c.f. law of large numbers), but on the other hand maybe it’s higher at 5 seconds because it’s more obvious what to do and you can just straightforwardly do it faster. My best guess is that p would increase as horizon length increases, but am not confident.
If p is increasing as horizon length increases, then we have the equivalent of option (1) above (if it starts at >80%). If it’s decreasing, then there’s a question of whether it asymptotes above 80%, which I’m also unsure about. One way to think about this is: let’s say the probability of success by the baseliner on the task is p_b. Then, if the sped-up human is able to carry out 100 independent “trials” and tell if they’ve achieved the task, the minimum probability they should be able to achieve is 1 - (1-p_b)^100. p_b will depend on the specifics of the baselining process, but if it’s at least ~0.02, then the minimum success rate is >80%. This might point toward option (2) rather than (3), i.e. an asymptote above 80%.
So overall, if coders are deterministic then coders sped up 100x have infinite time horizons, and if there is randomness then they likely still do, but less clearly.
Takeaways for the case of ASIs
Are ASIs more similar to sped up humans with or without randomness? At first I thought the answer would be with randomness, but it’s plausible that an ASI could with high fidelity simulate the human coder’s brain except faster, which would give them an infinite time horizon.
Even with randomness, I expect ASIs to eventually be more analogous to human coders sped up 1 million times rather than 100x, which would make the p_b as described above have to be a maximum of 1.6e-6 in order to not lead to an infinite time horizon (i.e. 1.6 of a million).
So this thought exercise has updated me toward infinite time horizons happening.
Argument from long-horizon agency generalization
While this argument is less precise than the one from infinite time horizons, it’s meant to provide an intuition pump for how to think about superexponential time horizon growth, and to inform what the shape of the superexponential function is.
Individual humans are able to accomplish a relatively wide range of difficult tasks because we have, in addition to specialized knowledge, the ability to generally make progress on complex, many-step tasks. Below we will assume for simplicity that skills come from 2 buckets: long-horizon agency and specialized knowledge (though obviously these don’t encompass all real-world skills; specialized knowledge in particular is meant as a stand-in for skills that help with very short tasks).
There is often a recursive structure to doing tasks that take months to years, of which a simplified version might look like:
The skills needed to execute this loop well include:
Let’s call this bucket of skills long-horizon agency skills. It seems like for long enough tasks, these are the primary skills determining success, and importantly they are applied recursively many times. Such that, improving at long-horizon tasks is mostly loaded on improving at long-horizon agency, while improving at short-horizon tasks is mostly loaded on improving at specialized knowledge.
Let’s now consider AIs’ time horizons. Let’s start with extremes: consider the jump from 1 to 2 minute METR-HRS-Extended time horizons as opposed to the jump from 1,000 to 2,000 years. The 1 to 2 minute jump primarily comes from skills that help with “atomic tasks,” like specialized knowledge. On the other hand, going from a time horizon of 1,000 to 2,000 years is more loaded on long-horizon agency skills.
My best guess is that 2x jumps in horizon which are loaded on long-horizon agency skills will require less log(effective compute) than jumps that are loaded on specialized knowledge (they need to eventually, if time horizons are eventually infinite). This is because long-horizon agency skills generalize better: tasks and subtasks that rely on long-horizon agency benefit from skills that are more similar to each other than those that rely on specialized knowledge. And we should expect progress in closely related skills to be more sudden than those in more disparate ones, due to less variation.
The recent speedup in time horizon growth
Disclaimer: This is our view as of early December 2025. Future updates from METR could change this.
Titotal’s critique: The recent speedup in progress is probably a blip or a new faster exponential rather than the start of a superexponential.
Our response: Regarding the evidence provided by the recent blip, we agree that this isn’t strong evidence, we rely more on the conceptual arguments discussed above.
Functional form and parameters
Now let’s consider what superexponential functional form and parameter settings we should use. This is something that we are still highly uncertain about.
We didn’t spend much time considering different functions before we put out our original timelines forecast. Thus we used a simple one. We describe it below using the terminology of our upcoming model (our old model’s terminology defined a doubling decay rate that equaled (1 - the doubling difficulty growth factor)).
There's a doubling difficulty growth factor, d. The first time horizon doubling (in the present) requires 𝜏p effective compute orders of magnitude (OOMs), the second doubling requires d𝜏p effective compute OOMs, the third requires d2𝜏p effective compute OOMs, and so forth.
d=1 implies exponential growth, d<1 implies superexponential growth, d>1 implies subexponential growth. In our original model, in the superexponential growth case which had 45% weight, we set d=0.9.
Let’s consider what properties we want in a function and parameters. Properties we might want include:
Our function has properties (1) and (3) (regarding (3), see the next section on backcasts).
To test out property (2), i.e. whether the function is roughly consistent with our intuitions, we estimated the relative difficulty level of doublings at different time horizons, informed by the argument from long-horizon agency generalization. This is something we have substantial uncertainty about.
My intuition, shaped by my own experience with coding tasks that I’ve done, is that substantial superexponentiality will kick in sometime in the weeks-to-months range. It feels like a 4 month project involves much more of the planning, decomposing, and error-correcting than a 1 month project, to a larger extent than the difference between a 1 hour and 4 hour project. I become more confident as we discuss years-long projects, but still certainly not extremely confident.
Blinded as to what it implied for our functional form or parameters, I estimated the relative difficulty of doublings at different time horizons. The implications of my estimates were:
So, based on my rough intuitions, our functional form is too aggressive at low time horizons, relative to high time horizons. See the columns of AIFP timelines+takeoff model superexponential intuitions [link-shared] that refer to Eli for these calculations. To repeat again, I don’t think this is very strong evidence about d, but relative to other available evidence which is few and far between, it is substantial.
We tried out various other functions which might better fit my intuitions, but didn’t find a better one that is comparably simple, so for our upcoming model we stuck with the same function (with a median estimate of 0.92 for d, since e.g. 0.7 backcasts poorly and seems too aggressive compared to other trend extrapolations), but we are very open to changing it in future modeling.
How changing the present time horizon should affect behavior
Titotal: The behavior seems wrong in that it quickly reaches a singularity regardless of the [present] time horizon [if you don’t change other parameter values] (link)
Our response: In this section I will for simplicity discuss time horizon as a function of calendar time, with the understanding that in our model it is actually a function of log(effective compute) (these can come apart but it doesn’t affect the argument I’m making here).
In their critique, titotal noted (and criticized) that if we change the present-day time horizon, but use the same present doubling time and the same doubling difficulty growth factor, this perhaps surprisingly does not affect our model's prediction of when we get an infinite time horizon.
To state the reason behind titotal’s observation: Let t_1 be the present doubling time, and d < 1 be the doubling difficulty growth factor (in our original timelines model we had a doubling decay rate, which is 1 - the doubling difficulty growth factor). Then the time requirement for n doublings is:
t1+t1d+t1d2+...+t1dnAs we take n to infinity, the series converges at time t_1/(1-d), meaning that the time of the finite-time singularity depends only on t_1 and d and not on the present time horizon.
On the surface, titotal's critique looks like a bad sign. Shouldn’t our predictions be different if the present time horizon were 15 nanoseconds instead of 15 minutes?
After thinking this through, our view is that if we assume that the trend is superexponential, then if we lower the present time horizon, we should also increase the new present doubling time. We want to “shift” the curve to the right as pictured below (the green curve is shifted as we recommend, the red curve is what you get from only lowering the present horizon).
To be more concrete: let’s say we start with something like the blue curve, which has a present doubling time of 5 months.
Then we lower the present horizon from 15 minutes to 1 millisecond (as in the graph). We recommend shifting the curve to the right to get the green curve, such that by the time the green curve reaches a 15 minute time horizon, its doubling time is the same as the doubling time the blue curve starts with.
The reason we recommend this is that we think it’s most natural to think of the ease of doubling as being tied to the capability of the AIs and thus their current time horizon, rather than calendar time. Both of our arguments justifying superexponentiality above were made reference to specific time horizons (in one case infinite time horizons, in the other case time horizons which relied heavily on long-horizon agency skills). So we should keep the mapping of AIs’ time horizon to the doubling time at that point consistent.
It’s difficult to think about going backward because it’s unclear what it means to have a 1-millisecond time horizon,[15] so perhaps it’s easier to think about if we look forward. If the trend is superexponential, then we expect the doubling time at a 100-year time horizon to be faster than the current doubling time. So if we were doing this forecasting exercise at a 100-year time horizon capability level, we would have a faster initial doubling time (or lower effective compute requirement). Then, it wouldn’t make sense to reduce our model’s time horizon to 15 minutes without changing the initial doubling time, because we have observed the doubling time getting faster over time!
As discussed above, we don’t in practice think that our time horizon functional form is exactly correct, but it's the best approximation of our views that we’ve found thus far at the same level of simplicity. So we don’t expect the curve to look exactly like this in practice, and generally have high uncertainty. But the basic point holds that if you are assuming a superexponential function, you should shift the curve to the right rather than only lowering the present horizon.
Backcasts
How much should we care about backcasts?
titotal discusses how well our model backcasts, i.e. how well it does if you take our model and extrapolate our forecasting methodology to the past. For example, ignoring AI R&D automation, backcasting exponential time horizon growth would involve simply extending the exponential back in time so that if it e.g. doubled every 5 months before, now it halves every 5 months.
We follow titotal in primarily focusing on the models’ backcasts in the cases of superexponential and exponential time horizon growth, putting aside the smaller 10% of model simulations that involve subexponential growth (which generally backcast poorly). We’ll also follow titotal in focusing on time horizon and AI R&D progress multiplier as the variables that are backcasted.
How much should we care about our time horizon backcasts being accurate? As a general point, we give substantially less weight to backcasting points before GPT-3.5, and to some extent also GPT-3.5. That’s because the SWAA dataset[16] used for these seems qualitatively different from HCAST and RE-Bench, and also intuitively it feels like e.g. GPT-3 should have an essentially a 0 second 80% time horizon; it seems wrong to claim that it’s 2 seconds.
Now going through the types of backcasts and time horizon growth options:
In general, we have relatively few data points and the data points themselves are noisy, so we shouldn’t enforce too much rigidness on the model backcasts. That being said, we still think they are useful to discuss, and will explore them in this section.
Here we will only discuss our original time horizon extension model, which is simpler and the model that titotal primarily focused on.
Original time horizon extension model
Here is titotal’s backcast:
titotal made trajectories plotting each of superexponential-in-effective-compute and exponential time horizon growth, using Nikola’s median parameters. Remember that we expect our original model’s exponential backcast to look poor because it had a faster median doubling time than the historical one. However, we actually see the opposite: the exponential backcast looks decent but not great while the superexponential backcast looks poor.
We replicated this plot with Eli’s parameters. In addition to plotting the trajectory with median parameters, we also overlaid “central trajectories” of Monte Carlo simulations for each of superexponential, exponential, and our model trajectories which included uncertainty over the time horizon growth type.[20]
The trajectories extend slightly past the SC arrival date because we are plotting the externally seen horizons but the internal AIs are more advanced. The horizontal lines at the end of the trajectories represent the time needed to improve AIs’ cost and speed at that given horizon.
We see that the central trajectories are similar to the trajectories with median parameters. Regardless of which backcase we’re looking at, the takeaway is similar to titotal’s original graph: the exponential backcast looks decent but not great while the superexponential backcast looks poor.[21] This is indicative of a flaw in our model due to a bug, which we discuss next.
Backcasts with AI R&D progress multiplier interpolation bug fixed
AI R&D progress multiplier backcasts
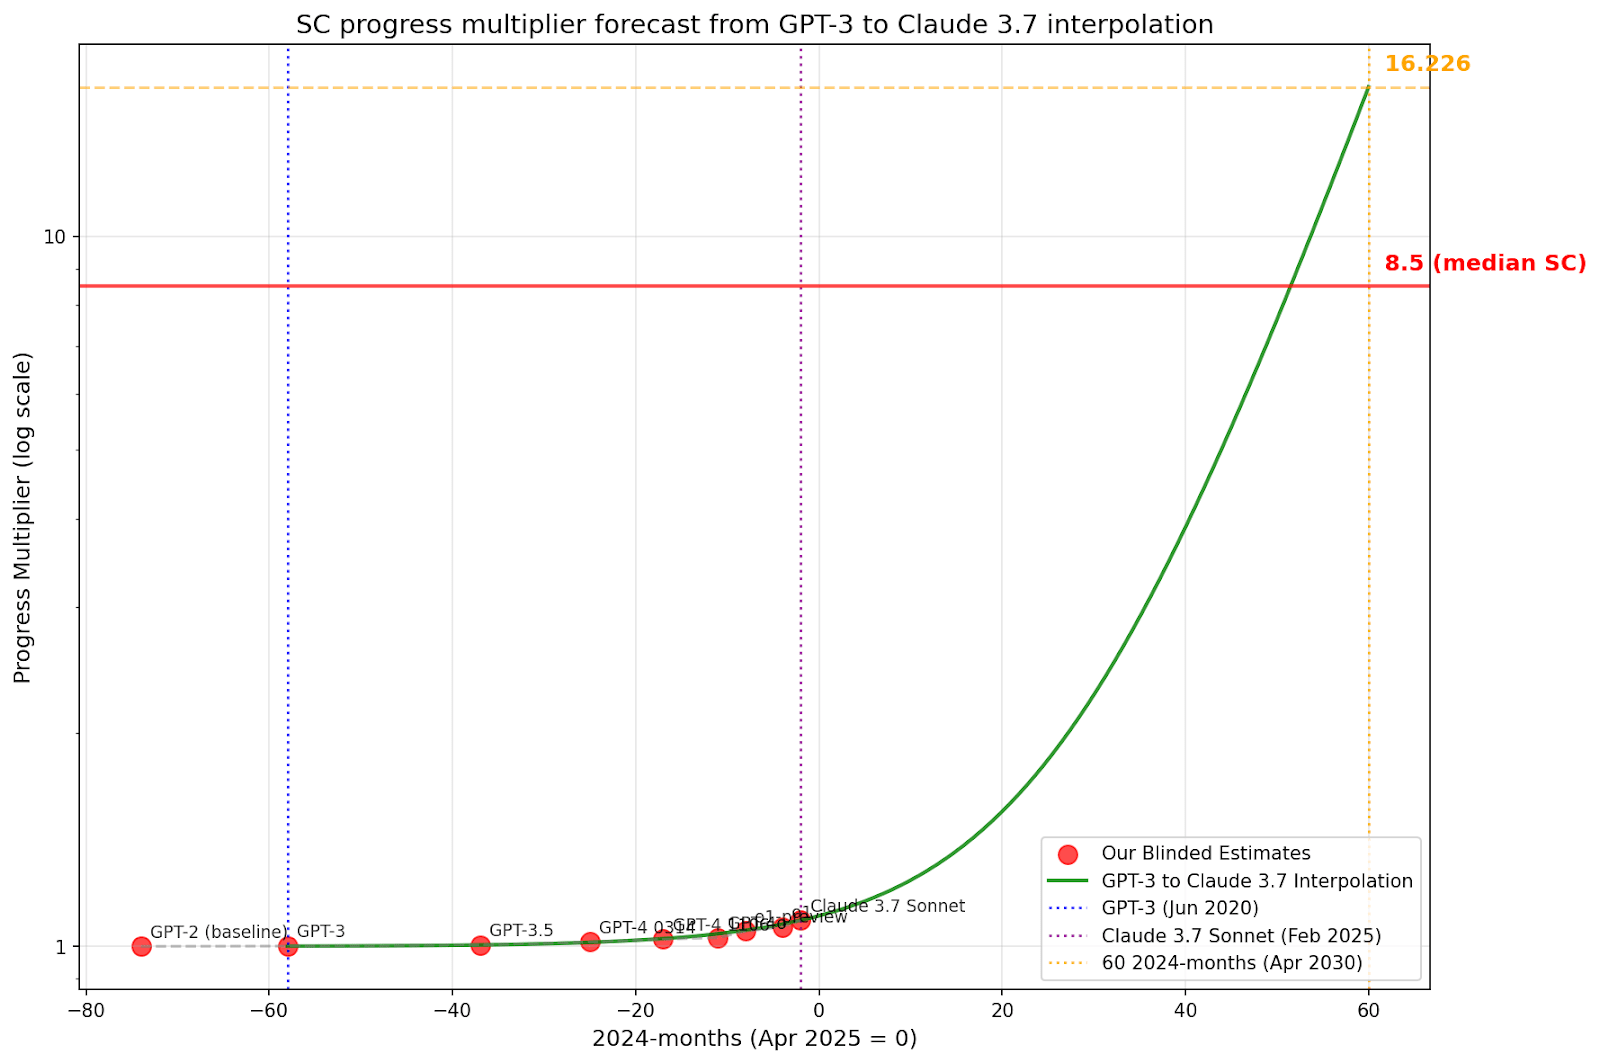
In the code for the original time horizon model, as effective compute[22] increased, the AI R&D progress multiplier was interpolated in log space between (current effective compute, current progress multiplier) and (effective compute at SC, SC progress multiplier). Concretely, in our time horizon extension model the median estimate for the current progress multiplier was roughly 1.1,[23] while Eli’s median estimate for an SC’s progress multiplier was 8.5. This means that halfway through the simulation in “2024-months” a.k.a. effective compute, the progress multiplier was the geometric mean of 1.1 and 8.5, which is 3.06.
This led to the backcasts displayed above, as well as the backcast displayed below (plotted by titotal), which plots the AI R&D progress multiplier over time. titotal discussed how this backcast is inconsistent with our own guesses for what the progress multiplier was in the past. Notably, this backcast results in speedup values below 1, which doesn’t make sense if the progress multiplier is defined as being compared against no AI usage.
However, this was a bug; it was different from Eli’s intentions.[24] What he meant to implement was an interpolation in log space between (current effective compute, current progress multiplier - 1) and (effective compute at SC, progress multiplier - 1), and then adding one to the result. For example, this means that halfway through the simulation in “2024-months” a.k.a. effective compute, the intended progress multiplier was the geometric mean of 0.1 and 7.5 plus 1, which is 1.87 (substantially lower than the implemented interpolation, which as discussed above resulted in 3.06). You can see the code for this bug fix here.
This interpolation was chosen based on intuitions that it’s approximately the same difficulty to go from an X% to 2X% speedup for all X.[25] This intended method was also chosen to never give a progress multiplier below 1 even when extrapolated backwards.
To test how well this intended interpolation backcasts, we did the same thing titotal did above but with the intended interpolation method. Before looking at the AI R&D automation backcast, we gathered an aggregate of 6 estimates,[26] including Eli and Daniel,[27] of progress multipliers for historical models, setting GPT-2 to a baseline of 1 (rounding because we think it is extremely close to 1). We set the interpolation to have a progress multiplier of 1.09 at Claude 3.7 Sonnet (our aggregate estimate) and 8.5 after 60 months at the 2024 effective compute growth rate (roughly the median requirement in our original time horizon extension model).[28] We then looked at how it backcasted compared to our historical estimates.
Ideally we would update the past points based on how effective compute growth has varied in the last 6 years, but we won’t here given that it has been somewhat close to constant, and we have done this in our upcoming mode. Below you can see the backcast (and you can see the raw data points here):
So, whereas titotal pointed out that the published code backcasts in a way strongly inconsistent with our own guesses about the past AI R&D progress multiplier, the intended/bug-fixed version does not have this problem (it isn’t exactly consistent, but it seems within the range of estimation uncertainty). In the next section we see that the intended version also backcasts time horizons better.
See the appendix for exploration of forecasting AI R&D progress multipliers from a GPT-3 to Claude 3.7 Sonnet interpolation.
Time horizon backcasts
Now we present a version of the above plot of our model’s time horizon backcasts, but with this bug fixed.
The reason that the superexponential trajectories fit better than previously is that this backcast doesn’t involve the AI R&D progress multiplier getting much smaller when backcasted (the most it can decrease by is 0.1, by going from 1.1 to 1). This is the result of the intuition described above regarding what sort of interpolation made sense. However, the nice fit is in significant part due to luck; we did not test this out before publishing. Had we tested it, we would have noticed and fixed the bug.
The exponential fit looks substantially worse than without the interpolation fix at predicting the earliest 3 points, as expected; previously it “luckily” looked like a good fit because the AI R&D slowdown in the past was substantial, fitting it well to the first few data points despite a faster doubling time. Meanwhile, this exponential backcast better fit the points from 2024 onward than the previous one.
Effect of interpolation bug fix on model outputs
We see that in isolation, fixing the AI R&D interpolation bug in our original time horizon extension model would have slowed median SC timelines down by 9 months, a substantial amount.
Comms criticisms
Summaries
Misleading presentation
titotal’s critique: We presented our forecast as rigorous in a way that was misleading. Example quotes: “presented as a forecast based on rigorous modelling and data analysis from forecasting experts,” “This combination of compelling short story and seemingly-rigorous research may have been the secret sauce that let the article to go viral and be treated as a serious project”
Our response: Forecasting SC timelines is an inherently difficult endeavor because current AIs are far less capable than SCs. We never claimed that our timelines forecasts were based on evidence as solid as that of, to use titotal’s example, physics. We did our best to not overclaim while balancing the fact that we do think our work is both (a) valuable and (b) has important implications. Here’s what we said in the first text on the website frontpage:
“We wrote a scenario that represents our best guess about what that might look like. It’s informed by trend extrapolations, wargames, expert feedback, experience at OpenAI, and previous forecasting successes.”
This seems correct (notice the word choice of “informed”). And in the “Why is it valuable?” expandable:
“We have set ourselves an impossible task. Trying to predict how superhuman AI in 2027 would go is like trying to predict how World War 3 in 2027 would go, except that it’s an even larger departure from past case studies. Yet it is still valuable to attempt, just as it is valuable for the U.S. military to game out Taiwan scenarios.”
We also have 2 expandables mid-late in the scenario explaining that our uncertainty increases as the scenario goes on.
Regarding the timelines forecast itself, we did not have as an explicit of a disclaimer,[29] though nowhere do we know of where we said that it was backed up by strongly empirically validated extrapolations. To make our views more clear, we have added the following disclaimer:
This forecast relies substantially on intuitive judgment, and involves high levels of uncertainty. Unfortunately, we believe that incorporating intuitive judgment is necessary to forecast timelines to highly advanced AIs, since there simply isn’t enough evidence to extrapolate conclusively.
Below we further respond to the specific claims that titotal made.
The “false graph”
titotal’s critique: We were sending out a “false graph” which appears to be generated using our model, but isn’t. Daniel and Scott have used the graph along with LLM releases as evidence in favor of AI 2027’s model. (link)
Our response: For the original plotted curve, the intention behind the curve was to plot an superexponential-in-time function with each horizon doubling getting 15% faster than the previous one.
Recently (well after titotal’s critique), we found a bug in the code that generated our displayed trajectory on all of the graphs which displayed a time horizon trajectory alongside points for past models. The bug was that instead of each doubling of time horizon doubling getting 15% easier, each doubling of log(time horizon) got 15% easier. Therefore we discuss both the original curve and the intended curve, which is the curve we would have produced if we had followed roughly the same procedure for creating the original curve, but with the correct functional form. The graph below displays both of these along with a central trajectory from our actual model.
The original curve is at the fringes of the distribution of our model trajectories, predicting more aggressive time horizon growth in 2025 before ending up in a similar spot at the start of 2027. The intended curve still predicts more aggressive near-term time horizon growth than the central trajectory, but to a much lesser extent than the original one. The intended one is fairly in distribution among model trajectories.
We apologize for the bug.
How big of a problem is it that neither the original nor the intended curve was an actual model trajectory? We agree with titotal that we should have done better regarding either (a) using a trajectory from our time horizon extension model rather than a simplified version or (b) more clearly denoting that the trajectory is not coming from said model.
That said, we think that while it was a mistake, titotal is overestimating the importance of this mistake. The graph described our intended methodology of each doubling getting 15% easier and didn’t make any claim to be generated by the timelines model, and while the text in the expandable wasn’t clear about this we don’t think it was a huge deal.
Regarding communications about how to update on LLM releases, again we apologize for not using an actual model trajectory. However, as you can see in the above graph, the original trend has higher time horizons in 2025 than the model’s central trajectory, and also higher than the intended trend.[30] This means that if we were using the model’s central trajectory, it would have looked like substantially more evidence in favor of short timelines. By using the illustrative trend instead of our central trajectory, we understated our case.
Misrepresentations of the model code
Titotal: “there are parts of the code that the write-up of the model straight up misrepresents.” (link)
Our response: We’re not sure exactly which set of issues this is supposed to refer to, but we think that while our model explanation could have been much better, there were no “straight-up misrepresentations.”
Going through each issue that titotal mentioned in their post:
titotal’s critique: We should make it more clear that we do intuitive adjustments on top of the RE-Bench logistic fit. (link)
Our response: In titotal’s writeup they initially mistakenly said that we didn’t include our time to saturation parameter in our writeup (and then retracted it after we pointed out the error). They maintain that the writeup implied that the direct output of our logistic regression was put into the model. We again agree it wasn’t fully clear and have clarified it now.[31] But we disagree regarding what the writeup implied. It said directly under our adjusted forecast as reasoning: “We expect the logistic forecast to slightly overestimate the rate of progress because we now have additional information that the first quarter of 2025 has passed with no new SOTA scores on RE-Bench reported by METR.” We also included our forecasts in the writeup, which differed from the logistic. Furthermore different forecasters had different predictions, which couldn’t happen if we directly inputted the outcome of the logistic fit.
titotal’s critique: Saying that changing the upper bound of the RE-Bech fit doesn’t change the forecast much, which is wrong. (link)
Our response: We agree this wasn’t fully clear, but it seems implied based on the context that we mean that changing the upper bound within the range we tested doesn’t change the forecast much. Still, we’ve clarified this.[32]
titotal’s critique: It’s misleading to call our exponential case an exponential because the curve is actually superexponential once AI R&D automation is taken into account. (link)
Our response: This seems like a difficult communication issue. We want to communicate that the curve is exponential in 2024-years or what in our upcoming model we call log(effective compute), but it’s reasonable for people to be confused when it’s not exponential in time. We’ve edited the writeup to add (before taking into account AI R&D automation) as a qualifier.
titotal’s critique: Not indicating that the present doubling time was extended as a long-term trend. (link)
Our response: We think it was not a misrepresentation but rather something that was not fully clarified. We have edited our writeup to have the qualifier “extended as a long-term trend).”
Misleading presentation of rigor, specific claims
Responding to titotal’s specific points regarding whether our presentation was misleading, adding on top of the above reply:
titotal’s critique: “A casual reader may see all the data and graphs and assume that the results of the forecast are rigorous and well founded extrapolations of empirical evidence, or based on strong conceptual understandings of what drives AI progress: I do not believe either assumption to be true.” and “This combination of compelling short story and seemingly-rigorous research may have been the secret sauce that let the article to go viral and be treated as a serious project (link 1, link 2)
Our response: As we’ve said above, we did our best to not overclaim while balancing the fact that we do think our work is both (a) valuable and (b) has important implications. We think that people familiar with AGI timeline forecasting understand that such forecasts must rely on some guesswork, but it’s possible we could have done better at communicating this to others.
titotal’s critique: “images of sophisticated looking modelling like the following” (link)
Our response: We’re not sure what part of our image was too sophisticated-looking, but this probably boils down to a disagreement about whether the work is adding value at all. Conditioning on it adding value, it seems good to communicate it as clearly as we can.
titotal’s critique: It is accompanied by five appendices of “detailed research supporting these predictions” and a codebase for simulations.
Our response: We stand by this. Everything is relative in the field of AGI forecasting, but we believe the research supporting our scenario was helpful for our own beliefs and we hope for many others. As above, it’s of course possible that we could have done a better job of communication.
titotal’s critique: ‘They state that “hundreds” of people reviewed the text, including AI expert Yoshua Bengio, although some of these reviewers only saw bits of it.’
Our response: Gary Marcus said that he ‘read a little piece of it in draft,’ not that he was only sent a bit of it. He was sent the full website. (We’re not 100% sure if titotal was implying otherwise, but we wanted to clarify.)
**titotal’s critique: “**The scenario in the short story is not the median forecast for any AI futures author, and none of the AI2027 authors actually believe that 2027 is the median year for a singularity to happen. But the argument they make is that 2027 is a plausible year”
Our response: Yes, we did think that 2027 was a plausible year, and we still think that (though our probability is lower than when we published AI 2027), and we think the timelines model provided some support for that (rough as it may have been, the basic ideas around time horizon extrapolation still remain). Our views aren’t only based on our literal timelines model though. An outside-of-model factor supporting the plausibility of AGI in 2027 is that many AGI company researchers think so. But we also consider factors pushing toward longer timelines; in our writeup, Eli noted that his all-things-considered median was longer than our models’. This was mostly due to thinking that the factors we weren’t modeling would be more likely to push toward longer than shorter timelines, which in aggregate has been right thus far. We’ve also now edited the website to clarify our views:
“(Added Nov 22 2025: To prevent misunderstandings: we don't know exactly when AGI will be built. 2027 was our modal (most likely) year at the time of publication, our medians were somewhat longer. For more detail on our views, see here.)”
The “false graph”, details
What we intended to do with our original plotted curve
This is the graph that we originally published on the AI 2027 website and tweeted out:
There was a bug in our code which will be discussed below, but the intention behind the dotted green curve (and the black curve in the past) was to plot an superexponential-in-time function with each horizon doubling getting 15% faster than the previous one.[33]
This was set to roughly get superhuman coder (SC) at the right time, based on an estimate for what time horizon is needed for SC that is similar to Eli’s median in the timelines forecast. This is essentially a simplified version of our time horizon extension model that doesn't account for AI R&D automation. Or another way to view this is that we crudely accounted for AI R&D automation by raising the decay.
Fixing a bug in the original curve
Recently, we found a bug in the code that generated our displayed trajectory on all of the graphs which displayed a time horizon trajectory alongside points for past models. The bug was that instead of each doubling of time horizon doubling getting 15% easier, each doubling of log(time horizon) got 15% easier. The original curve had another bug, but the effect was much smaller.[34]
In addition to the original curve, we’ve created the intended curve which represents the curve we would have produced if we had followed roughly the same procedure for creating the original curve, but with the correct functional form. Below we display both of these curves alongside our models’ trajectories filtered for those that achieve superhuman coder (SC) in March 2027, including a “central” one.[35]
The original curve is at the fringes of the distribution of our model trajectories, predicting more aggressive time horizon growth in 2025 before ending up in a similar spot at the start of 2027.
The intended curve still predicts more aggressive near-term time horizon growth than the central trajectory, but to a much lesser extent than the original one. The intended one is fairly in distribution among model trajectories.[36]
We apologize for the bug.
How big of a problem is it that neither the original nor intended curve was not an actual model trajectory?
The graph was not intended to represent our overall median forecast as our SC median was later. In AI 2027 SC happened in March 2027. At the time of publishing, Daniel’s all-things-considered median was 2028, and Eli’s was 2030, and our two models with Eli’s parameters had medians of Aug 2027 and Dec 2028, respectively. Instead the graph was intended to represent roughly the trajectory that happens in AI 2027.
Here was the text accompanying it in the expandable on our website:
We agree with titotal that we should have done better regarding either (a) using a trajectory from our time horizon extension model rather than a simplified version or (b) more clearly denoting that the trajectory is not coming from said model. We’ve updated the expandable on the website to better communicate this. We’ve also made a revised version of the graph which contains the original curves plus also model trajectories, while noting in both the text and the figure that we’ve edited it.
Why didn't we use a central trajectory from our timelines model rather than our attempt at a simplified curve? This was on Eli’s to-do list, but he ran out of time. As you can imagine, we were working right up until a deadline and didn't get to many to-dos that would have been great to have. But very likely Eli should have prioritized it more highly, especially given that there was also a consequential bug in the curve generation, so we acknowledge this mistake.
That said, we think that while it was a mistake, we also think that titotal is overestimating the importance of this mistake. The graph described our intended methodology of each doubling getting 15% easier and didn’t make any claim to be generated by the timelines model, and while the text in the expandable wasn’t clear about this we don’t think it was a huge deal. When we tweeted it to a wider audience, most people wouldn’t know about our timelines model, and would assume instead that it is roughly the capability progression in AI 2027, which was the intended meaning of our curve (though the graph may have communicated more precision than we intended). For the small fraction of people who knew enough about our timelines model, it’s plausible they assumed it was generated by it, as was also plausible for the original expandable.
Claims regarding new evidence
titotal also criticizes us for claiming that new METR data points are evidence in favor of our forecast, because the graph isn’t an actual trajectory from our full model.
Here is the graph in question:
Scott Alexander said: “I’m especially happy with the horizons post, because we got it out just a few days before a new result that seems to support one of our predictions: OpenAI’s newest models’ time horizons land on the faster curve we predicted, rather than the slower seven-month doubling time highlighted in the METR report:”
Daniel Kokotajlo said: “It's still way too early to call of course, but new data seems to be consistent with AI 2027's controversial superexponential prediction:”
Recall that the original trend has higher time horizons in 2025 than the model’s central trajectory, or the intended trend.[37] This means that if we were using the model’s central trajectory, it would have looked like substantially more evidence in favor of short timelines. By using the illustrative trend instead of our central trajectory, we understated our case. (Though, again, we didn’t think much about this at the time; we didn’t think it was a huge deal to use the illustrative trend instead of wrangling the model.)
So overall we think our point about the direction to update in stands, though as implied by Daniel’s tweet (“way too early to call”), it was only minor evidence at the time. It’s also mostly evidence regarding doubling speed as opposed to superexponentiality.
That said, it would have been better to be more precise in our modeling and communication.
Responses to all other concrete criticisms
titotal’s critique: We should have uncertainty regarding the starting time horizon. (link)
Our response: We think that this is plausible, but wouldn’t have a large impact on the result, and we don’t think it’s obvious that it is preferable conceptually.
titotal’s critique: We should do more exploration of model trajectories. (link)
Our response: We agree, and we also want to make it easier for others to explore trajectories. Our upcoming model will have a web app making it easier for others to explore how the model behaves.
titotal’s critique: Our model is too complicated given the lack of past data points. (link)
Our response: We agree simpler is better, all else equal, and we value simplicity when making modeling decisions. That said, it’s also better to model dynamics that we think might have a substantial impact on the model’s predictions. If not included, we would want to make intuitive adjustments for many of these dynamics anyway so we think it’s more transparent and informative to include these in the model quantitatively.
titotal’s critique: We shouldn’t guess the upper limit for the RE-Bench logistic fit. (link)
Our response: We think this was reasonable, we believe making judgmental parameter estimates to inform statistical models is often good. The estimate we made for the upper bound was based on our forecast of the maximum achievable score on RE-Bench, which was informed by METR’s estimates in their paper and the scores that had already been achieved thus far by human baseliners. You can see our reasoning as written in the original forecast here. There is no RE-Bench module in our upcoming model.
titotal’s critique: It’s bad to make substantial judgmental adjustments on top of the RE-Bench logistic fit. (link)
Our response: We think this is reasonable to make judgemental adjustments in cases where we have reason to believe that the trend extrapolation is incorrect in some way (e.g. in this case for Eli, he thought the trend extrapolation was not including enough uncertainty).
titotal’s critique: The RE-Bench section doesn’t have a point. (link)
Our response: We basically agree, this was in substantial part an artifact of us being pressed for time. We have gotten rid of this in our upcoming model.
titotal’s critique: It doesn’t make sense to lower the time horizon doubling time post-RE-Bench saturation in the cases where it’s not superexponential. (link)
Our response: At the time, we were trying to balance the possibility of exponentiality or superexponentiality while making a point estimate. It would have been more complicated to split these up. But we agree that this was not implemented in an ideal way. The time horizon part didn’t play that large of a role in the benchmarks and gaps model anyway, so keeping the doubling time the same wouldn’t have made a large difference in the results. There is no RE-Bench module in our upcoming model.
titotal’s critique: The RE-Bench saturation doesn’t backcast well, especially for the exponential curve. (link)
Our response: The graph for Eli’s settings is below:
Confusingly, this graph isn’t a full apples to apples comparison because the time horizon in the benchmarks and gaps model is actually different from the time horizon measured by the METR data points. The time horizon in the benchmarks and gaps model is defined by what it would be if the top experts were doing the baselining, rather than METR’s actual baselining process. We’ve edited the timelines writeup to make this more clear.[38]
The non-top-expert time horizon is higher than the top-expert one, so making an adjusted graph would shift both curves up by a factor of perhaps 5 or so. This would improve the fit of the superexponential curve for recent data points while making it worse for ones pre-2023. The exponential curve would be a bit closer but remain poor, but that’s expected as described above. There would also be a difference due to titotal using median point estimates which would be smaller.
RE-Bench doesn’t appear in our upcoming model.
titotal’s critique: Eli’s engineering complexity gap estimate is inconsistent with the possibility of superexponentiality. (link)
Our response: This might be true. In our upcoming model parameter estimations we’ve removed explicit estimation of portions of gaps, though retain parameters for including a gap if one would like (so essentially, it combines the original two timelines models into one).
titotal’s claim: Our model went viral. (link)
Our response: It seems pretty clear that AI 2027 went viral, but our timelines model did not. The timelines model was not meant to provide close to the majority of the value from the AI 2027 scenario + supplements.
titotal’s critique: Despite wide confidence intervals, the model still severely underestimates uncertainty. (link)
Our response: We think this is true to some extent, we also have outside-of-model uncertainty.
titotal’s critique: Our model (e.g. the equations and parameters) isn’t well-explained or justified. (link)
Our response: We agree that our original model writeup had lots to be desired here. We will improve upon this in our upcoming model release.
Our upcoming model release
We’ve been working on a new, unified timelines+takeoff model that we aim to release soon. We will update this post to link to the model once we release it.
The timelines portion of the model is like the time horizon extension model, except one can optionally have an effective compute gap on top of the required time horizon (the gap is not explicitly broken down into components).
It also models automation in a more gears-level way, including properly accounting for diminishing returns to software research effort. There is no portion that involves RE-Bench.
In terms of addressing the concrete criticisms of our model that we agreed with:
Acknowledgments
We thank Alex Kastner for assisting with the superexponential time horizon growth section, and Em Cooper and Joshua Turner for feedback.
Appendix
Defining effective compute
By effective compute, we mean the amount of training compute we’d need to train AIs as performant as a given AI using the training process of a reference point. The reference point is usually the time at which we are making the prediction, e.g. currently the reference point would be 2025. So for example GPT-7 would have an effective compute of however much compute it would take to match its performance using 2025 training methods (with a relatively small allowance for adaptations to make use of the increase in compute).
Forecasting AI R&D progress multipliers based on an interpolation between GPT-3 and Claude 3.7 Sonnet
We also tried doing a forecast where we fit the interpolation from GPT-3 (1.0008) and Claude 3.7 Sonnet, then extrapolated a forecast to 60 2024-months.
The following graph zooms in on the interpolation portion.
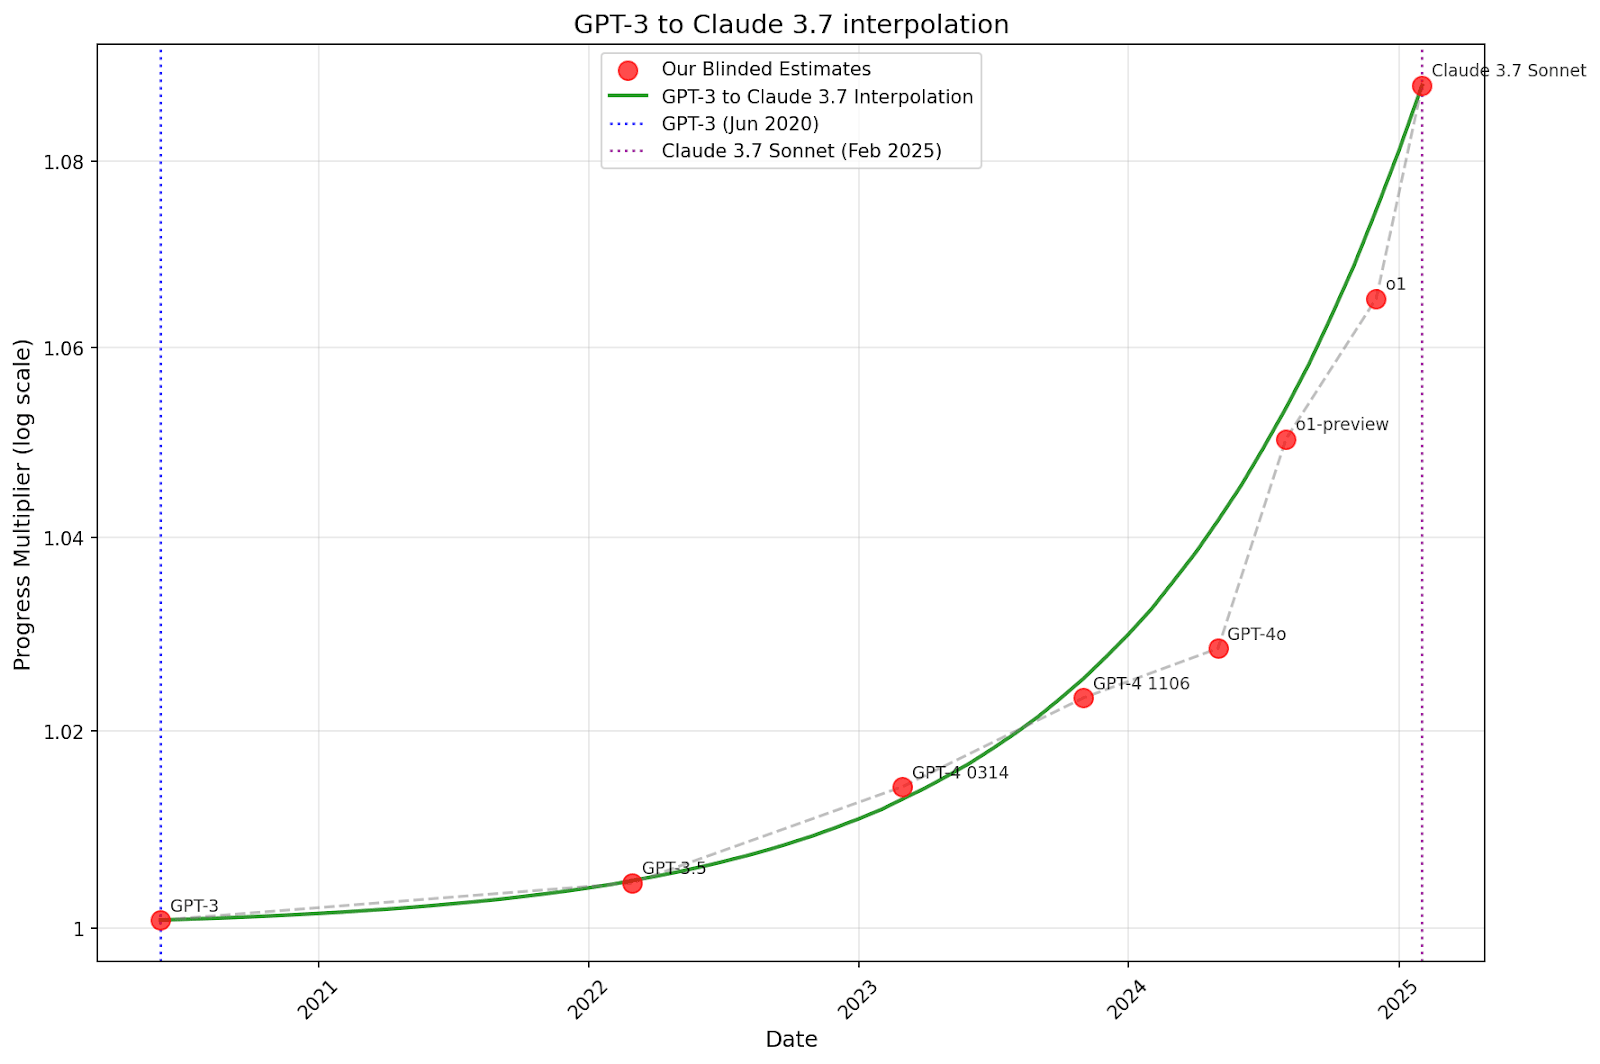
While not perfect, these graphs look pretty good given the simplicity of the method.
In the time horizon extension method, we started at 1.1 in present day, which is roughly the same multiplier we ended up with above when comparing to GPT-2 or essentially no AI assistance. However, in our original model, we used this 1.1 as a multiplier on top of 2024-months, implying a 1.1x multiplier only since 2024. This didn’t make sense given that, as we can see above, the multiplier was roughly 1.03-1.08 throughout 2024, meaning the relative increase was less than 1. In our upcoming model all of this is handled more elegantly because we are explicitly modeling lots more things.
Median parameter estimates vs. median of Monte Carlo simulations
titotal did their analysis with our median parameter estimates rather than incorporating uncertainty. titotal explicitly flagged this simplification in their post. We checked, and this does not seem to affect the date at which SC is achieved much compared to the median of our Monte Carlo simulations.
This is because the most important portion of the model, once fixing the time horizon growth functional form, is the number of 2024-months required. Let’s just consider the exponential case for simplicity. The number of 2024-months required is determined by the current doubling time * log_2(SC time horizon / current time horizon). Current doubling time is sampled from a lognormal. SC time horizon is also sampled from a lognormal, but then we take the log of it. Thus we are multiplying a lognormal by a normal.
Multiplying a lognormal by a normal that’s essentially always positive results in the median of the product being lower than the product of the medians.[39]
On the Benchmark and Gaps model
We are focusing primarily on the time horizon extension model, and not the benchmark and gaps, in this response. We’re doing this since in our upcoming model we’ve gotten rid of the RE-Bench portion (though still have an optional gaps component), and titotal mostly focused on our time horizon extension model.
Effect of addressing issues
Effect of fixing AI R&D interpolation bug on top of original model
Note that the results are slightly different from those in the original timelines forecast due to sampling error.
Effects of fixing AI R&D interpolation bug on top of May update
Note that the results are slightly different from those in the original May update due to sampling error.
Comparing graph curves against model with AI R&D interpolation bug fixed
In places where we’ve added significant edits to our timelines writeup since titotal’s critique, we’ve denoted that they have been edited ↩︎
Harvard University, member of technical staff at METR ↩︎
We wouldn’t literally always advise this, sometimes high-variance decisions can be the right choice, but we agree it’s a good heuristic. ↩︎
titotal didn’t bring up in their critique that the flawed argument was in a footnote rather than the main text. ↩︎
In our original model we called this “2024-years,” but it had the same functionality as effective compute. ↩︎
See also: “the fit of this new model to historical data is not attempted.” (link) ↩︎
We discuss log(effective compute) instead of calendar time, because although log(effective compute) has recently grown ~linearly in time, it may eventually become decoupled from time due to automation and changes in compute and human labor growth. ↩︎
The “intrinsic difficulty” version of the benchmark could potentially also be superexponential (or subexponential) depending on the measure of intrinsic difficulty, but in our writeup we focus on human-relative definitions. ↩︎
It could also grow subexponentially in time, for example due to slowdown in compute growth. We don’t expect (an extended version of) the Epoch Capabilities Index to have a finite-time singularity, we expect it to cap out at some number based on the limits of intelligence. ↩︎
Since tasks may not be literally the same as ones done at an AGI company, the tasks are baselined by coders who do the ones that are most similar. Also, in our original timelines forecast, we did not specify which humans would be doing the baselining at higher horizons. ↩︎
Since METR-HRS only contains tasks that take human baseliners at most 30 hours to complete and we want to forecast up to much higher levels, we define a procedure that could in principle be used to extend the task suite even though it would not be practical to actually do so. It’s important to define which human baseliners are used during the extension: the more competent they are, the larger an impact we should expect at any given time horizon. We assume that METR finds human baseliners who take the same amount of time to complete tasks as a typical AGI company programmer who does similar tasks. We think that this might be loosely consistent with their past baselining, and this also represents a simple assumption that translates relatively well to real-world impacts. ↩︎
METR did not specify in their paper any efficiency requirements for the AIs to meet. In our opinion, there must be either an explicit or implicit efficiency definition. Including definitions might lead to an easier to achieve requirement, for example a high compute budget. Lower efficiency requirements would mean that AIs’ time horizons would be higher, so it would be directionally easier to achieve an infinite time horizon, but we don’t think it affects the basic structure of the argument given that our efficiency requirements seem easily achievable for capable enough AIs. ↩︎
In the original passage from METR, they wrote "horizon length" here instead of "time horizon". We changed this for clarity because the current convention seems to be to associate time horizons to AIs and horizon lengths to tasks. ↩︎
What if ASI has an extremely large finite time horizon instead of an infinite time horizon? We think this might still point toward superexponentiality. Here's a sketch of how such an argument might go. We first use methods other than METR time horizon extrapolation to forecast the effective compute required for ASI (e.g. biological anchors, revenue trends). Separately, we make a guess about the very large time horizon an ASI would have (e.g. 1 million years or 1 billion years). Then we remark that no exponential trend that is close to fitting past data would reach such an extremely large time horizon by that time (or log(effective compute)) we predicted for ASI. For example, bio anchors predicted TAI would require X, which would imply a time horizon of Y if we assumed exponential growth, which seems potentially too low for TAI. ↩︎
The fact that it’s unclear what it would mean could also be an argument that it’s okay for a model to not predict well in that setup. ↩︎
Software Atomic Actions, an benchmark METR made to measure the time horizons of pre-2023 models. ↩︎
Looking at the evidence we’ve seen since publication (which wasn’t the primary source of our update: GPT-5 was released on Aug 7 at a 26 minute horizon, we published our model on April 1 with Claude 3.7 Sonnet at a 15 minute starting horizon (which was released on Feb 24). If we use the Claude 3.7 Sonnet date we get 5.5/(log(26/15)/log(2)) = a ~7 month implied doubling time, so on the long-term trend. While if we start with the model publication date (which was actually used in our simulations) we get 3.2/(log(26/15)/log(2))=~4 month doubling time, so on the recent trend. ↩︎
For example, we mostly agree with this post arguing that the current empirical data should not not be treated as strong evidence for superexponentiality. That said, we also therefore think that the data should not be treated as strong evidence against superexponentiality either. ↩︎
Re-named to AI software R&D uplift in our upcoming model. ↩︎
We calculate central trajectories by (a) filtering for trajectories that achieved SC in the same month as the median of our Monte Carlo simulations, (b) calculating a “median curve” which includes the median time horizon of all filtered trajectories at each month, then (c) for each month since 2021.0, for each trajectory, compute the distance to the median curve in log(horizon) space, then average across timesteps. The central trajectory is the trajectory with the minimum average distance from the median curve. ↩︎
That said, compared to titotal’s trajectories, the superexponential backcast looks slightly worse and the exponential looks substantially better. We’ve verified that Eli and Nikola’s median parameter trajectories look quite similar, so this seems like an issue with titotal’s backcast. ↩︎
We didn’t call it that at the time, but implicitly it was effective compute. ↩︎
1 + sqrt(.03*.3)=1.095 ↩︎
Unfortunately the writeups for the timelines and takeoff model were not precise enough to demonstrate Eli’s intentions. We have now updated them. The closest thing to proving Eli’s intentions is that in the original version of the code progress multiplier parameters are represented as the actual progress multiplier minus one, which would have been strange if Eli didn’t intend to interpolate between the progress multipliers minus one rather than the progress multipliers themselves. The bug was fairly simple and should have been caught, Eli takes responsibility for this. ↩︎
Or at least, this is the simplest method that seems about right. ↩︎
We aggregated using a geometric mean of (progress multiplier - 1) estimates. See this spreadsheet for our raw estimates. ↩︎
Besides Eli and Daniel, the data points came from 3 AI Futures Project MATS scholars and one author of the original timelines forecast (Nikola). ↩︎
Note that for simplicity we are assuming that the rate of log(effective compute) increase in the past has stayed the same, and think doing so wouldn’t change the takeaways of the results (informed by our most recent modeling which does model effective compute in the past). Titotal also made this simplifying assumption in their post. ↩︎
That said, placing the three different forecasts prominently in the graph at the top of the supplement—including FutureSearch’s, which had a 2032 median—might implicitly convey the idea that different reasonable parameter choices can lead to substantially different results. ↩︎
The graph for this curve also had a bug fixed from the original one, but one that didn’t affect behavior much compared to the bug fix from this curve to the intended one. ↩︎
By adding: “Below are our forecasts for the date of RE-Bench saturation, informed by but not only derived from the logistic forecast above.” above the forecast. ↩︎
Italics is what we added: The upper bound of RE-Bench is not known, so we will model it as a normal distribution with a mean of 2.0 and a standard deviation of 0.25. Changing the upper bound (edited to add: within this range) doesn’t change the forecast much — a change of 0.25 in the upper bound moves the saturation date around half a year. ↩︎
There was also a more minor placement error on the graph, Claude 3.7 Sonnet should be at 15 rather than 30 minutes. This was fixed in the version that has been on our website since July. ↩︎
Then function used, instead of the correct implementation of each doubling getting 15% easier, was: y = e^(0.395 × t^1.15), where y is the y-value on the graph i.e. it has a linear relationship with log(horizon). This made little difference because only a few doublings of log(horizon) occur between 8 seconds and a few years. ↩︎
The central trajectory was calculated by (a) filtering for trajectories that achieved SC in the same month as the median of our Monte Carlo simulations, (b) calculating for each trajectory for each month starting in 2025.25 the sum of distances in log(horizon) space to every other trajectory, (c) summing for each trajectory over all months and selecting the trajectory with the minimum cumulative distance (you can see an example of a central trajectory compared to all trajectories below). ↩︎
In the appendix we include a version of the graph compared against the version of our model with the AI R&D progress multiplier interpolation fixed. ↩︎
The graph for this curve also had a bug fixed from the original one, but one that didn’t affect behavior much compared to the bug fix from this curve to the intended one. ↩︎
We’ve added: The Benchmarks and Gaps time horizon definition assumes that humans are top-expert-level, while the time horizon extension’s definition doesn’t. This is because we are starting at a point at which AIs have matched top experts on RE-Bench. Apologies for any confusion on this. ↩︎
The intuition behind this is something like: let’s say the lognormal draws a 25th percentile that’s 1.2x lower than the median. Let’s assume that the median has a mean of 100 and standard deviation of 10. In this case the normal needs to be at most 100*1.2=120 to be below the product of the medians, so at most 2 SDs above the mean. Now let’s consider a 75th percentile draw of the lognormal, for which we need at least 100/1.2=83 to be above the product of the medians so at least 1.7 SDs below the mean. Thus we can see that when the lognormal is 25th percentile, there is a higher chance of the product being smaller than the product of medians than the chance that in the 75th percentile case the product is larger than the product of medians. Thus the median of the product is lower than the product of medians. ↩︎