yup, nines are a very nice measure of high availability of a system and they can work as a measure of risk delta too (though a thing being 10x more dangerous can sound more salient than the same thing being 1 less nine of safety 🤔)
could you explain how you would use it for predictions, please? if I imagine he would say -0.3 instead of 15%->30% I can't imagine that would help my understanding of ryan_greenblat's world model in any way, the rest of the article (qualitative information with examples and scenarios) is what I found useful...
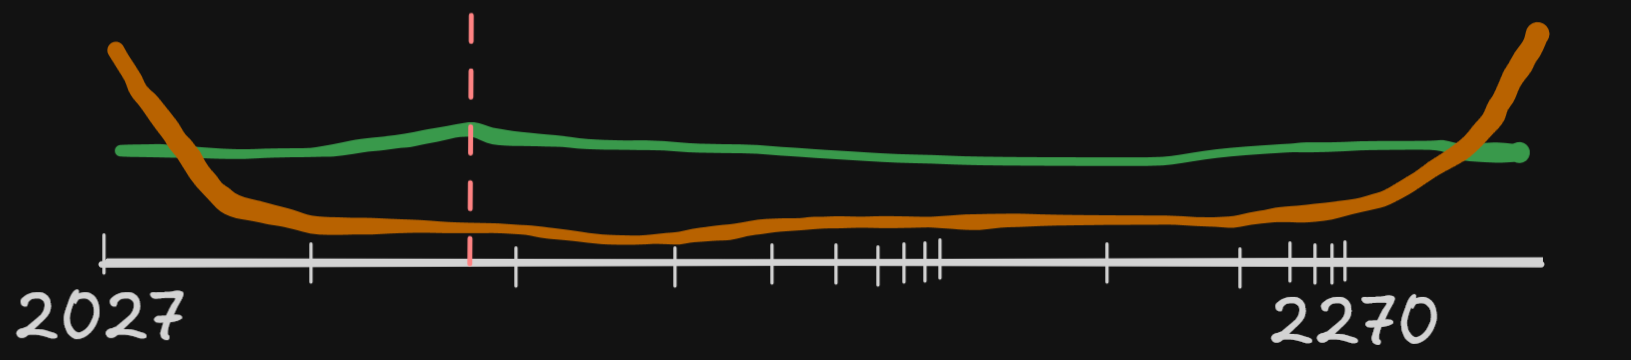
One way to convert this probability estimates into something actionable is to convert them into time estimates - how much time we have to find solution for AI Safety. It depends of the shape of probability curve and our lowest acceptable risk estimate.
I would agree that pdfs are nice, but I am not sure my action space has meaningful wiggle room to appreciate the small beans counting around proxy indicators of AI safety markers...
If it was the case that a thing that didn't happen by the end of 2028 would allow everyone reasonable to say "we are basically fine for the next century" then I would track the estimates with more curiosity.
But if it's about 1 year shorter or longer until doom and no one will stop the race towards AGI if the predicted thing happens while also no (other) one will stop worrying about x-risk if the predicted thing doesn't happen, then I don't really care about that prediction ¯\_(ツ)_/¯
(there are people who's job is to care even about the small bumps, so I'm not saying it's not useful for anyone, but if there was a prediction market for "Anthropic will have literally zero human employees by the end of 2028" I would NOT bet on it using Kelly criterion downstream of either 15% or 30% of some technical abstract probability reported by someone who is into timeline predictions, I would just say "nope, I am not into sports betting, thank you")
Yes, P doom are meaningless until we have some idea how it can be change. If P doom will have absolutely fixed probability, we can just ignore it.
If we have timing, small changes in it are meaningless, but if it is order of magnitude changes, it has implication on how I spend my remaining life.
https://www.lesswrong.com/posts/TyusAoBMjYzGN3eZS/why-i-m-not-a-bayesian
In most cases, when we mention probability, we're using bayesian framework. The lack of description power of a scalar probability may be caused by the limits of bayesianism.
In terms of logits (log odds), the probabilities 0.1 and 0.9 are actually quite close together: -2.2 and +2.2, for a logit range of
yes, I learned something that I later realized wasn't true, but now I forgot what I wanted to illustrate with saying that 🙈, let me update the post to use 0.1 + 0.2 == 0.30000000000000004 as straightforwardly confusing about float32 and not a confusion that I learned a wrong lesson
My intuition about probability doesn't match the linear distances between percentage points.
With some percentages, 51% and 49% makes all the difference, such as in company ownership and voting.
But with other percentages, 15% and 30% point estimates of timeline prediction make me wish to have a "plus or minus Knightian uncertainty" emoji, screaming in ignorance "that's basically the same number, no?!?".. the feeling is similar to my reaction when I first learned the result of
0.1 + 0.2and0.3are two different numbers in float32[1]. I understand why, but also .. yuck!If some of the variables in a world-model can change the prediction from "that's basically impossible" to "oh, it already happened", I wish smarter people than me invented better communication tools about that. Something less awkward than decibels or bits though.. something that would feel like cubic-bezier(1,0,0,1).
The least I can hope for is more examples and qualitative splits (if/else, scenarios, ...) before collapsing an estimate to a single weighted number.
edit: previous version said that I learned 0.1 and 1/10 are different numbers in float32, but that's not the case and I forgot to say that the learning was wrong and I had to unlearn it .. and now I have no idea what I was trying to say with that story