Quantifying average costs:
(There were fewer trick-or-treaters in the past, so the denominator is lower than 33 million per year, but I think that's overwhelmed by road safety improvements making modern trick-or-treating safer---total pedestrian fatalities are currently similar to their long-term average despite our growing population, and child fatalities in particular seem even lower.)
While I appreciate the analysis, I also recently saw this article circulating: https://jamanetwork.com/journals/jamapediatrics/article-abstract/2711459
It compares just 6pm-midnight on Halloween versus the corresponding time one week early and one week later. They estimate a 10x increase in deaths in age 4-8 children - see Figure 1. This doesn't look like subgroup fishing since the 9-12 group is also quite large (6x increase). By your 5x correction factor, Halloween would still be more dangerous than other days for kids.
I still think it could be true that Halloween is less dangerous since this hasn't measured pedestrian activity and trick-or-treat really might be a greater than 10x increase in 4-8 year olds out on the street. But this definitely makes it look less good to me than your presentation.
That analysis is using the same dataset I'm using, but restricting to 6pm-midnight. This has even more of the denominator problem I'm talking about: almost no kids are out walking 6pm-midnight on a typical day, since that's dinner and bedtime. So 5x is likely much too small a factor to account for how many more kids are out.
Your graph shows an ~40% risk compared to the normal day in that age group. Using their risk ratio you would need about 25x times the child pedestrian activity to achieve that risk reduction. That could be the case, but I'm not certain. I'm not even that confident that you'd get the >10x needed to ensure a decrease in risk. Kids tend to go to hot spots for trick-or-treating, so the really busy streets that get >25x and spring to mind easily might be hiding the (relatively) depleted streets elsewhere that account for a larger fraction of typical walking. Hence I think your presentation is optimistic: it's right to push back on the raw numbers but I don't think it's clear that Halloween is substantially safer than other nights per pedestrian-hour as you claim.
I also read the denominator problem differently. I took your argument to claim that 5x number to be a lower bound for the "trick-or-treating streets compared to the same streets on a typical night" and for that, it's definitely true. But then you had to gloss over the fact that we're comparing entire days (and non-trick-or-treating streets) and it's much less clear that 5x is true for all-of-Halloween compared to all-of-another-day. Therefore, their analysis justified using your 5x number while I think your analysis was stretching the truth.
I would believe 25x, or even 50x for fall evenings, and I think 10x+ is overwhelmingly likely: it's just very few children that are out during those hours normally.
I'm not approaching this by thinking about how many children you see on the street during Halloween, but about how what fraction of children are typically out in the evening and what fraction of children trick or treat.
In other words, we should be telling children 'be careful of roads/cars' (including on Halloween) Not 'be careful of Halloween'
I agree with the post, but I will point out that you really do need to emphasize the utility per micromort here. If you keep your utility constant, it is the total risk that matters. Just like if you were going to go on a long car ride tomorrow (on safer-than-usual roads, but not enough to outweigh the total driving) and someone points out you're much more likely to die than usual - sure, you can point out 'ah yes, but the chance I die per-mile is lower than usual!' but that's not the right reference point if your utility isn't a function of the driving-amount.
All that said, the total number of deaths is only ~double on Halloween? That feels so insane, roads must be SO much safer than usual.
we should be telling children 'be careful of roads/cars' (including on Halloween) Not 'be careful of Halloween'
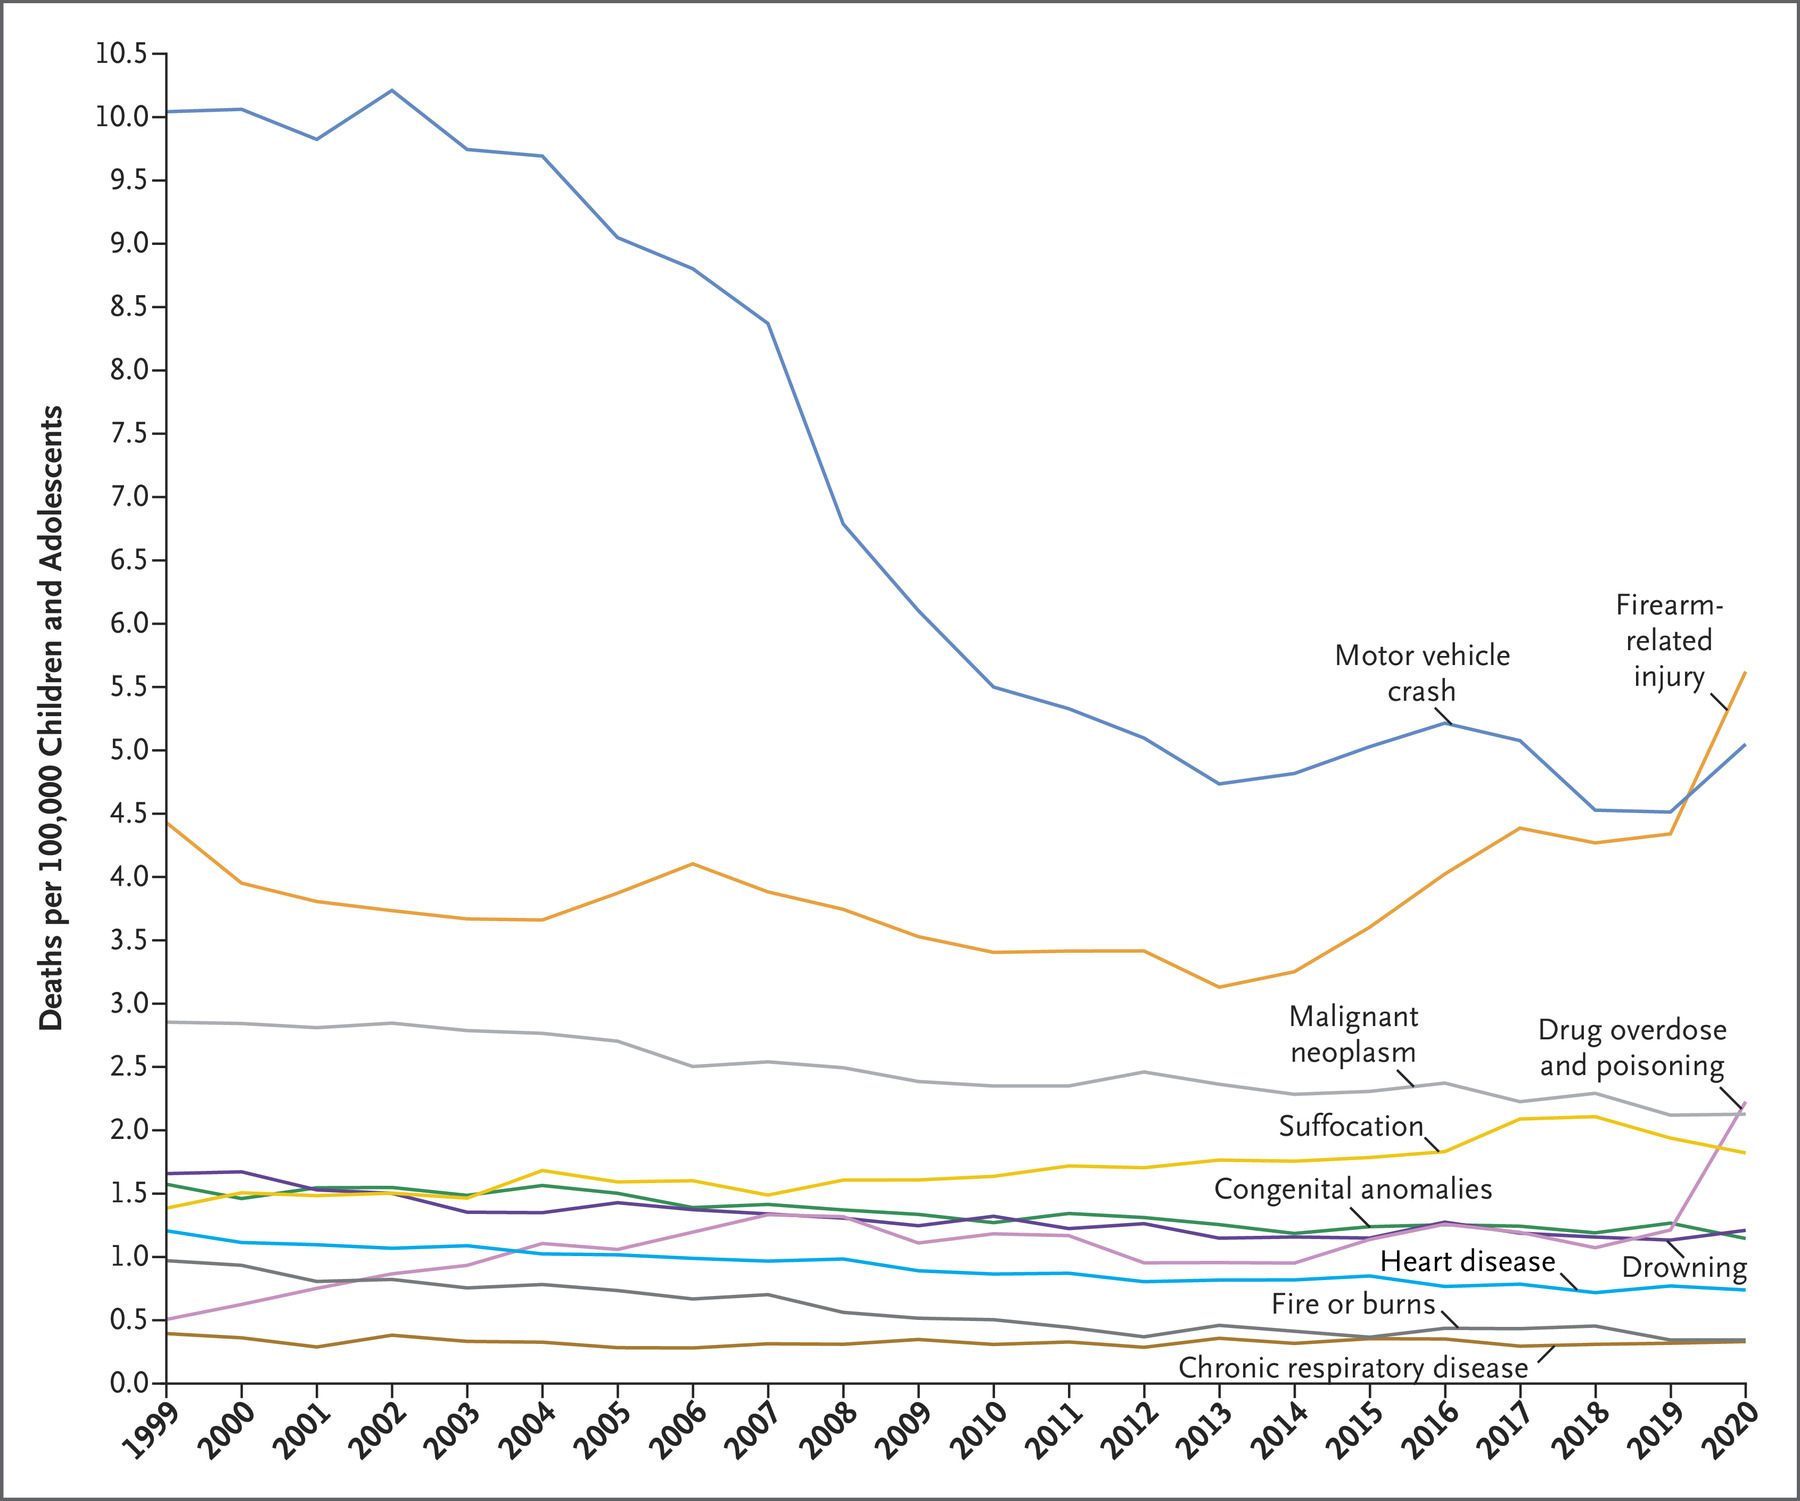
Yes, but even then not unduly so. Child pedestrian deaths per FARS are about 0.5 per 100k (320 per 72M), which puts them below guns (5 per 100k), driving (4 per 100k), drugs (3 per 100k), suffocation (2 per 100k), drowning (1 per 100k), etc: https://www.jefftk.com/goldstick-causes-of-child-deaths.jpg. Total deaths under age 18 are about 37k/y, so 320 pedestrian deaths is about 1% of deaths. Worth careful teaching, but still fine to let them walk to their friends' houses once they're ready.
utility per micromort here
Not sure I understand what this paragraph is getting at?
roads must be SO much safer than usual.
But it's also dark and chaotic.
While this doesn't change the basic conclusion from the data, does the data provide any data related to:
1: while the data is supposed to include all traffic fatalities, it includes few injuries, and in recent data it only includes fatalities
2: I don't see that in the data:
$ head -n 1 2020/person.csv | tr ',' '\n' | cat -n
     1	STATE
     2	STATENAME
     3	ST_CASE
     4	VE_FORMS
     5	VEH_NO
     6	PER_NO
     7	STR_VEH
     8	COUNTY
     9	DAY
    10	DAYNAME
    11	MONTH
    12	MONTHNAME
    13	HOUR
    14	HOURNAME
    15	MINUTE
    16	MINUTENAME
    17	RUR_URB
    18	RUR_URBNAME
    19	FUNC_SYS
    20	FUNC_SYSNAME
    21	HARM_EV
    22	HARM_EVNAME
    23	MAN_COLL
    24	MAN_COLLNAME
    25	SCH_BUS
    26	SCH_BUSNAME
    27	MAKE
    28	MAKENAME
    29	MAK_MOD
    30	BODY_TYP
    31	BODY_TYPNAME
    32	MOD_YEAR
    33	MOD_YEARNAME
    34	TOW_VEH
    35	TOW_VEHNAME
    36	SPEC_USE
    37	SPEC_USENAME
    38	EMER_USE
    39	EMER_USENAME
    40	ROLLOVER
    41	ROLLOVERNAME
    42	IMPACT1
    43	IMPACT1NAME
    44	FIRE_EXP
    45	FIRE_EXPNAME
    46	AGE
    47	AGENAME
    48	SEX
    49	SEXNAME
    50	PER_TYP
    51	PER_TYPNAME
    52	INJ_SEV
    53	INJ_SEVNAME
    54	SEAT_POS
    55	SEAT_POSNAME
    56	REST_USE
    57	REST_USENAME
    58	REST_MIS
    59	REST_MISNAME
    60	AIR_BAG
    61	AIR_BAGNAME
    62	EJECTION
    63	EJECTIONNAME
    64	EJ_PATH
    65	EJ_PATHNAME
    66	EXTRICAT
    67	EXTRICATNAME
    68	DRINKING
    69	DRINKINGNAME
    70	ALC_DET
    71	ALC_DETNAME
    72	ALC_STATUS
    73	ALC_STATUSNAME
    74	ATST_TYP
    75	ATST_TYPNAME
    76	ALC_RES
    77	ALC_RESNAME
    78	DRUGS
    79	DRUGSNAME
    80	DRUG_DET
    81	DRUG_DETNAME
    82	DSTATUS
    83	DSTATUSNAME
    84	HOSPITAL
    85	HOSPITALNAME
    86	DOA
    87	DOANAME
    88	DEATH_DA
    89	DEATH_DANAME
    90	DEATH_MO
    91	DEATH_MONAME
    92	DEATH_YR
    93	DEATH_YRNAME
    94	DEATH_HR
    95	DEATH_HRNAME
    96	DEATH_MN
    97	DEATH_MNNAME
    98	DEATH_TM
    99	DEATH_TMNAME
   100	LAG_HRS
   101	LAG_HRSNAME
   102	LAG_MINS
   103	LAG_MINSNAME
   104	WORK_INJ
   105	WORK_INJNAME
   106	HISPANIC
   107	HISPANICNAME
   108	LOCATION
   109	LOCATIONNAME
   110	HELM_USE
   111	HELM_USENAME
   112	HELM_MIS
   113	HELM_MISNAME
   114	VPICMAKE
   115	VPICMAKENAME
   116	VPICMODEL
   117	VPICMODELNAME
   118	VPICBODYCLASS
   119	VPICBODYCLASSNAME
   120	ICFINALBODY
   121	ICFINALBODYNAME
You can get the age of the driver by looking at the age of the person with PER_TYP equal to one.
Within years, the combo of ST_CASE and STATE uniquely identifies accidents, so an intermediate step is tracking the accident ID. Then you could classify accidents as involving a child as those where at least one of the decedents is under a certain age, then use that PER_TYP variable to look at the ages of the driver(s) for those accidents. Cool analysis, btw--I've worked a lot with the FARS and happy to help :)
Yeah, the most promising by-day interventions I've heard proposed is day-specific regulation of driving, such as lower speed limits, closing of residential roads to thru traffic, etc.
Nicely done!
The question is what should be the denominator of the risk?
For societal aggregate worries: Day? Sure.
For personal risk: Day? Nope. Person-day? Yes!
Even for societal aggregate worries it's only worth using days as the denominator if the potential interventions you're considering scale by days and not person-days. For example "stay-home on Halloween" or "move Halloween earlier" has costs proportional to the latter.
What about (e.g.) risks from kids ingesting candy sourced from multiple unknown people (any one of whom could poison a whole lotta kids with decent chances of not getting caught)? Maybe tell kids to only accept cash?
risks from kids ingesting candy sourced from multiple unknown people (any one of whom could poison a whole lotta kids with decent chances of not getting caught)?
This is something people have worried about a bunch, but it doesn't actually happen: https://en.wikipedia.org/wiki/Poisoned_candy_myths
Afaict that page says it happened twice - William Shyne gave out candy coated laxative pills, and Ronald O'Bryce gave out poison-laced pixie stix
content warning: discussion of child fatalities
I've seen this chart going around:
Sperling and Smith created it from NHTSA FARS data, and there have been lots of news stories about it or the underlying data. Some people have a "lets make costumes brighter" angle, some see this as ammunition in the fight against car-centric culture (which I support), some people want to move Halloween earlier in the day. But I think everyone is missing the point: Halloween is actually one of the safest days to be out walking as a kid.
Let's look at the data. I started by replicating the chart to verify I was doing it correctly (code):
The dip on February 29th is mostly just that this day only occurs once every four years, so it has about a quarter the deaths you'd expect. But what about the spike on 4/30? On April 30th 1992 someone drove their car into a large group of 3rd graders on a field trip, and one of them died. It turns out the FARS records can include cases where someone else died in the same accident. Filtering to just the records representing deaths I get:
The data available actually goes back to 1982 and now runs to 2020, so we can expand it a bit:
We can also break down by age, since "child" can mean a range of things and most people are likely thinking mostly about younger children:
All this is to confirm the original chart: more children do die on Halloween than on a typical day. But I still don't think that's a reason to keep your kids home on Halloween, even when you set aside the consideration that Halloween is an especially fun time to be a child pedestrian.
The issue is, there are a lot more kids out on Halloween than the typical day. If you learned that more people died in car crashes in the US (42k/y) than in Paraguay (1.6k/y) you wouldn't conclude that Paraguay's roads are safer: the US has 50x more people than Paraguay! We would ideally scale the initial chart by the number of children out walking on any given day, but I don't think anyone has numbers on this. Very roughly, though, maybe it's something like 5x as many people (kids, parents, grandparents) out on foot on Halloween than the typical day?
Every pedestrian is rolling some dice. The dice are pretty favorable: of the ~70M people under age 18 in the US only 320 died in 2020 by being hit by a car. But you still might want to avoid days where the dice were less favorable than usual. Looking at the original chart you might conclude that Halloween was one of those days, but if there are a lot more kids walking around on Halloween it's actually one of the safer days.
Comment via: facebook