To me, this felt like a basically successful revival of a LessWrong tradition I enjoyed. Thank you to everyone who took the time to fill it out.
Agreed, great job Skyler!
I couldn’t come up with one obviously best way to show what’s going on [for the probability section]. After a lot of messing around with graphs and charts, there were two ways to display things that I settled on.
May I suggest ridgeline plots?
No chance you could edit in a bit more about what the questions were? I don't really know what e.g. "Calibration IQ", "Californian LW", or "Heavy AI" mean.
The LessWrong Review runs every year to select the posts that have most stood the test of time. This post is not yet eligible for review, but will be at the end of 2025. The top fifty or so posts are featured prominently on the site throughout the year. Will this post make the top fifty?
Which religion claims nothing supernatural at all happened?
Secular versions of Buddhism, versions of neo-paganism that interpret themselves to ultimately be manipulating psychological processes, religions whose conception of the divine is derived from scientific ideas, etc. More generally, many religions that define themselves primarily through practice rather than belief can be compatible with a lack of the supernatural (though of course aren't necessarily).
In regards to HPMOR, a reaction gif: https://i.imgur.com/LhlHBhb.mp4
In regards to cryonics, here's a relevant market I made recently: https://manifold.markets/NathanHelmBurger/full-digitization-not-necessarily-e?r=TmF0aGFuSGVsbUJ1cmdlcg
When I first looked at that graph I had no explanation for the sudden drop, but then I realized the missing years between 2016 and 2022 got me. I think what we’re looking at is a bit of a bump in 2022 (possibly due to the smaller sample) and then a return to where we were in 2016. Is that a just-so story? Eh, possibly.
Doesn't it look like the second and third quartiles are lower than they used to be? Like, AFAICT, if you ignore 2022, you just have downward trends in those quartiles of reported IQ.
Right: If you ignore 2022, then the drop isn't as sudden. If you're just looking at 2022 and 2023 and comparing those two, the IQ quartiles drop about five points across the board. 2023 is lower than 2016, but not "hot damn look at that chart" lower, just "huh, yeah I guess I can see it if I zoom out or squint" lower.
Here's the thread for discussion of future censuses. I know I plan to try and cut the total number of questions down.
Anyone have better ideas for the politics section? Some people have a lot of fun with this but it's not my area of interest.
To the four people who picked 37 and thought there was a 5% chance other people would also choose it, well played.
Wow, that's really a replicable phenomenon
Time on LessWrong (in average minutes a day):
15.4 + 17.8 (5, 10, 20) [n=492]In buckets:
>=0 to <=30: 452, 100.9%
>30 to <=60: 32, 7.1%
>60 to <120: 6, 1.3%
>=120 to <1000: 2, 0.4%
The bucket percentages look off here. 100.9% made me raise an eyebrow.
Yep, that's a mistake and should be fixed now. I'm not quite sure what I did that resulted in that mistake but it was probably something typo-like.
Quick response where I will go more in-depth later: based on the the mean scores for the bonus political questions and the norms+5-factor model I've gotten from a sample on Prolific, here's some beliefs that likely correlate with being a member of LessWrong: https://gist.github.com/tailcalled/98bf4a487add3ef70fe6c0d7827dc3bd
Are you predicting the LW responses or is a model you made predicting them?
-0.37 If you see ghosts, you should believe in ghosts. (Predicted LW response: Disagree)
I find this opinion weird, probably because there are multiple reasonable interpretations with quite different truth-values.
I kinda disagree - if you see ghosts, almost all the probability space should be moving to "I am hallucinating".
On one interpretation of the question: if you're hallucinating then you aren't in fact seeing ghosts, you're just imagining that you're seeing ghosts. The question isn't asking about those scenarios, it's only asking what you should believe in the scenarios where you really do see ghosts.
I mean, sure, but that does kinda answer the question in the question - "if event X happens, should you believe that event X is possible?" Well, yes, because it happened. I guess, in that case, the question could be more measuring something like "I, a Rationalist, would not believe in ghosts because that would lower my status in the Rationalist community, despite seeing strong evidence for it"
Sort of like asking "are you a Rationalist or are you just saying so for status points?"
Also if you fill out this table then I can easily generate a corresponding list for any other case (e.g. an individual, the means from a community you've distributed these questions to, the means from a subset of the responses from the survey data, etc.):
The Data
0. Population
There were 558 responses over 32 days. The spacing and timing of the responses had hills and valleys because of an experiment I was performing where I'd get the survey advertised in a different place, then watch how many new responses happened in the day or two after that.
Previous surveys have been run over the last decade or so.
2009: 166
2011: 1090
2012: 1195
2013: 1636
2014: 1503
2016: 3083
2017: "About 300"
2020: 61
2022: 186
2023: 558
Last year when I got a hundred and eighty six responses, I said that the cheerfully optimistic interpretation was "cool! I got about as many as Scott did on his first try!" This time I got around half of what Scott did on his second try. A thousand responses feels pretty firmly achievable.
This is also the tenth such survey that’s been run. We missed a proper ten year anniversary in 2019, and in 2022 I was mostly focused on making the survey happen at all. Still, this is a cool milestone, and in celebration I’m going to be dipping into the datasets from previous years a lot. Unfortunately that doesn’t mean I have ten surveys worth of data; bit rot and the rotation of census runners means I only have access to about half of these.
I’ll talk about other surveys more later on. For the moment, let's talk about the basic breakdowns.
There’s two main formats I’m going to present information in.
One of them is where I'm not treating the answers as numbers. Here, I present
Let's use Relationship Status as an example.
Relationship Status:
Single: 263, 48.3%
Relationship: 170, 31.3%
Married: 111, 20.4%
263 people said they were single. That's 48.3% of the answers.
The other format is where I have the mean and standard deviation. If you see a sequence of numbers like "30.1 + 8.9 (24, 28, 34) [n=186]" those numbers are "Mean + standard deviation (1st quartile, 2nd quartile, 3rd quartile) [n= number responding]." For an example, let's use Age.
Age: 30.5 + 9.2 (24, 29, 36) [n=552]
The mean is 30.5, the standard deviation is 9.2, the first quartile is 24, the second quartile (AKA the median) is 29, the third quartile is 34, and 552 people answered the question. If you're not familiar with statistics, the first number is basically an average and the last number is how many people answered the question.
Previous LessWrong Surveys:
Have you taken previous incarnations of the LessWrong Census/Survey?
No: 349, 64.6%
Prefer not to answer: 25, 4.6%
Yes: 166, 30.7%
I. Demographics
Age: 30.5 + 9.2 (24, 29, 36) [n=552]
Then of course, there’s times when it just made sense to me to treat a question differently. While the median age is useful, I also wanted to break it down into chunks so I could go by age group.
Under 20: 47, 8.5%
20 to 29: 236, 42.7%
30 to 39: 191, 34.6%
40 to 49: 53, 9.6%
50 to 59: 17, 3%
60 to 69: 8, 1.4%
That makes intuitive sense. We’re mostly a community of twenty and thirty year olds. To make it a little visually clearer, here’s a graph:
[I forgot to label my axes. The vertical axis is the number of respondents who gave that answer, the horizontal axis is how old they said they were.]
That’s better, but I’m specifically curious about how the age of the community has changed over time. What happens if I pull the ages from all the censuses I have?
[I forgot to label my axes. The vertical axis is the number of respondents who gave that answer, the horizontal axis is how old they said they were. Each line is a different survey year.]
This mostly tells me that 2016 was a really good year for surveys. Fine. I’m going to come back to this later rather than get bogged down, but I’m not done with this.
The rest of the comparisons over time I saved for their own section.
Country:
United States of America: 274, 49.6%
Canada: 39, 7.1%
Germany:37, 6.7%
United Kingdom:34, 6.2%
Russia:20, 3.6%
France:17, 3.1%
Australia:16, 2.9%
India: 11, 2.0%
Finland,: 9, 1.6%
Poland: 9, 1.6%
Netherlands: 7, 1.3%
New Zealand: 7,1.3%
Norway: 7, 1.3%
Denmark: 5, 0.9%
Hungary: 4, 0.7%
Israel: 4, 0.7%
Other: 52, 9.4%
[I often rounded anyone at 3 responses or below to Other. Here Other is mostly a collection of Eastern European countries.]
Race:
White (non-Hispanic):434, 78.9%
Asian (East Asian):27, 4.9%
Asian (Indian subcontinent): 23,4.2%
White (Hispanic): 20, 3.6%
Middle Eastern: 14, 2.6%
Black: 4, 0.7%
Other: 28, 5.1%
[If you see a big Other, you should assume I’m rounding a lot of categories with small responses.]
II. Sex, Gender, Relationships
Sex (At birth):
Male: 486, 89.3%
Female: 58, 10.7%
Gender:
With what gender do you primarily identify?
Male (Cis): 411, 75%
Female (Cis): 52, 9.6%
Female (Trans): 32, 5.9%
Non-binary: 29, 5.4%
Male (Trans): 3, 0.6%
Other: 15, 2.8%
[Did you know you can de-anonymize yourself with one write-in if your gender is specific enough and the person running the census talks to enough rationalists? “Poly Rationalist AGP Goth Househusband” made me grin. And no, “Catgirl” didn’t show up even once.]
Sexual Orientation:
Heterosexual: 395, 75.5%
Bisexual: 86, 15.8%
Homosexual: 27, 5.0%
Pansexual: 8, 1.4%
Other: 13, 2.4%
Relationship Style:
Prefer Monogamous: 305, 56.2%
Uncertain/ No Preference: 140: 25.8%
Prefer Polyamorous: 91, 16.8%
Other: 7, 1.3%
Number of Current Partners:
0: 250, 46.1%
1: 252, 46.5%
2: 26, 4.8%
3: 13, 2.2%
4: 1, 0.2%
5: 1, 0.2%
Relationship Goals:
...and currently not looking for more relationship partners: 309, 58.5%
...and currently looking for more relationship partners: 219, 41.%
Relationship Status:
Single: 263, 48.3%
Relationship: 170, 31.3%
Married: 11, 20.4%
Living With:
Who do you currently live with most of the time?
With Partner/Spouse: 190, 34.9%
Alone: 145, 26.7%
With Parents/Siblings: 100, 18.4%
With roommates: 95, 17.5%
Other: 14, 2.6%
[Other here was mostly variations of living with family other than siblings and parents, such as children.]
Children:
How many children do you have?
0: 467, 85%
1: 27, 5.0%
2: 31, 5.7%
3: 12, 2.2.%
4: 6, 1.1%
5: 1, 0.2%
More Children:
Are you planning on having more children?
No: 210, 39.0%
Yes: 186, 34.5%
Uncertain: 143, 26.5%
III. Work and Education
Work Status:
What do you currently do?
For-Profit Work: 196, 35.8%
Student: 143, 26.1%
Self-employed: 48, 8.8%
Unemployed: 45, 8.2%
Non-profit work: 36, 6.6%
Government Work: 24, 4.4%
Academics (Teaching): 23, 4.2%
Independently Wealthy: 12, 2.2%
Other: 21, 3.8%
Profession:
In what field do you currently work or study?
Computers (Practical): 183, 34.8%
Computers (AI): 82, 15.6%
Computers (Other academic): 32, 6.1%
Engineering: 29, 5.5%
Mathematics: 29, 5.5%
Finance/Economics: 22, 4.2%
Physics: 17, 3.2%
Business: 14, 2.7%
Other “Social Science”: 11, 2.1%
Biology: 10, 1.9%
Medicine: 10, 1.9%
Philosophy: 10, 1.9%
Law: 9, 1.7%
Art: 7, 1.3%
Psychology: 6, 1.1%
Statistics: 6, 1.1%
Other: 49, 9.3%
Highest Degree:
What is your highest degree earned?
None: 23, 4.2%
High school: 116, 21.2%
2-year degree: 17, 3.1%
Bachelor's:192, 35.0%
Master's: 122, 22.3%
Ph D.: 55, 10.0%
MD/JD/Other professional degree: 12, 2.2%
Other: 11, 2.0%
Have You Completed Your Formal Education:
Yes: 322: 58.4%
Uncertain: 67, 12.2%
No: 162, 29.4%
IV. Politics and Religion
Political:
Which of these labels do you most identify with?
Liberal: 159, 32.3%
Libertarian: 124, 25.2%
Social Democrat: 110, 22.3%
Socialist: 31, 6.3%
Anarchist: 22, 4.5%
Green-party: 15, 3.0%
Conservative: 10, 2.0%
Syndicalist: 7, 1.4%
Communist: 6, 1.2%
Reactionary: 6, 1.2%
Christian Democrat: 3, 0.6%
Last year I mistakenly let people freely answer “Other” with a write-in. That resulted in some pretty interesting answers, though I suspected it created spoiler effects. Looks like that hunch was right: without write-ins, Liberal is the most common answer.
Political Write-in:
I’m not going to try and do statistics to this. Seventeen people managed to coordinate on Centrist, another sixteen managed to coordinate on None. A few people wrote an answer from the options, like Liberal. After that it was a free for all. Notable answers include Georgists with ~4, Pirates with 2, Koestlerian Holarchist with 1, Non-radical rationalist woke (Traditional) with 1, and one person who says they’ve never thought about it.
Religious Views:
How would you describe your religious views?
Atheist and not spiritual: 367, 67.1%
Agnostic: 75, 13.7%
Athiest but spiritual: 57, 10.4%
Committed Theist: 20, 3.7%
Deist/Pantheist/etc: 15, 2.7%
Lukewarm Theist: 13, 2.4%
Religious Denomination:
If you are religious, which best describes the religion you practice?
Not religious, but I accidentally clicked a radio button: 33, 27.%
. . .
[No seriously, that was the highest response. Removing that. . . ]
Christian (Catholic): 13, 14.9%
Christian (Protestant): 10, 11.5%
Jewish (Reform): 9, 10.3%
Mixed: 7, 8.0%
Buddhist: 14, 16.1%
Unitarian Universalism or similar: 5, 5.7%
Jewish (Conservative): 4, 4.6%
Other: 28, 32.2%
[There’s a couple of different ways to do this. Here’s a version where instead of binning the small groups to Other, I binned them to the main denomination. That is, I got rid of the parenthesis, and ignored everyone else..]
Christian: 24, 27.6%
Jewish: 16, 18.4%
Buddhist: 14, 16.1%
Muslim: 3, 3.4%
Hindu: 2, 2.2
Family Religion:
How would you describe the religious views of your family when you were growing up?
Lukewarm theist: 193, 35.8%
Committed theist: 132, 24.5%
Atheist and not spiritual: 94, 17.4%
Agnostic: 49, 9.1%
Mixed: 32, 5.9%
Atheist but spiritual: 28, 5.2%
Deist/Pantheist/etc: 8, 1.5%
Other: 3, 0.6%
Religious Background:
What is your family's religious background, as of the last time your family practiced a religion?
Christian (Protestant): 187, 35.8%
Christian (Catholic): 134, 25.7%
Not religious in living memory: 41, 7.9%
Christian (Other non-Protestant, eg Eastern Orthodox): 39, 7.5%
Mixed: 31, 5.9%
Jewish (Reform): 25, 4.8%
Jewish (Orthodox): 12, 2.3%
Jewish (Conservative): 10, 1.9%
Unitarian Universalism or similar: 8, 1.5%
Christian (Mormon): 6, 1.1%
Hindu (Vaishnavism): 4, 0.8%
Traditional Chinese: 3, 0.6%
Buddhist ( Mahāyāna): 2, 0.4%
Hindu (Shaivism): 2, 0.4%
Quaker: 2, 0.4%
Other: 16, 3.1%
Moral Views:
With which of these moral philosophies do you most identify?
Accept / lean toward consequentialism: 340, 63.9%
Accept / lean toward virtue ethics: 86, 16.2%
Other / no answer: 77, 14.5%
Accept / lean toward deontology: 29, 5.5%
V. Numbers Which Attempt To Measure Intellect
IQ: 135.4 + 10.6 (130, 135, 140) [n=137]
IQ Age: 18.5 + 8.1 (13, 18, 22.25) [n=140]
SAT out of 1600: 1498.5 + 92.8 (1475, 1520, 1560) [n=131]
SAT out of 2400: 2238.9 + 146.7 (2180, 2280, 2340) [n=61]
ACT out of 36: 33.1 + 2.8 (32, 34, 35) [n=80]
[IQ Age is what age you were when you took the IQ test. There are two different SAT maximums because from 2005 to 2016 the maximum score was different.]
VI. LessWrong, the Basics
Referrals:
How did you find out about Less Wrong?
Referred by Harry Potter and the Methods of Rationality: 149, 28.5%
Referred by a link on Slate Star Codex / Astral Codex Ten: 85, 16.3%
Referred by a friend: 58, 11.1%
Referred by a link on another blog: 50, 9.6%
Been here since it was started in the Overcoming Bias days: 41, 7.8%
Referred by a search engine: 39, 7.5%
Referred by an Effective Altruism site: 21, 4.0%
Referred by a newspaper or other news source that was positive towards Less Wrong: 5, 1.0%
Don't remember: 4, 0.8%
Other: 71, 12.6%
HPMOR continues to be a large source of referrals. I talk about this later when doing interyear comparisons, but HPMOR is basically always the largest source of referrals. I wanted to check if this was purely an artifact of the people who joined back when it was being written, and nope; here's what the responses look like if you remove everyone who's been in the community for more than 5 years:
Referred by Harry Potter and the Methods of Rationality: 65, 21.5%
Referred by a link on Slate Star Codex / Astral Codex Ten: 56, 18.5%
Referred by a friend: 39, 12.9%
Referred by a link on another blog: 33, 10.9%
Referred by a search engine: 25, 8.3%
Referred by an Effective Altruism site: 20, 6.6%
Referred by a newspaper or other news source that was positive towards Less Wrong: 5, 1.7%
Been here since it was started in the Overcoming Bias days: 4, 1.3%
Other: 55, 18.2%
Some of you may have noticed that four people said they've been in the community for five years or less and also said they've been here since it was started in the Overcoming Bias days. One explanation is that they mean Overcoming Bias recommended them and that was the best way they could give that answer. Another explanation is you can't trust everything people say on the internet.
LW Use:
How do you use Less Wrong?
I lurk, but never registered an account: 124, 22.6%
I've registered an account, but never posted: 109, 19.9%
I've posted a comment, but never my own post: 122, 22.2%
I've made my own post, but never gotten a front page tag: 65, 11.8%
At least one post I made got a front page tag: 129, 23.5%
Sequences:
About how much of Yudkowsky's Sequences have you read?
Never even knew they existed until this moment: 16, 2.9%
Know they existed, but never looked at them: 35, 6.3%
All or nearly all of the highlights: 27, 4.9%
Some, but less than 25%: 94, 17.0%
About 25% of the Sequences: 52, 9.4%
About 50% of the Sequences: 59, 10.7%
About 75% of the Sequences: 58, 10.5%
All or nearly all of the Sequences: 211, 38.2%
Codex:
About how much of Codex - a collection of Scott Alexander's posts- have you read?
Never even knew they existed until this moment: 66, 12.0%
Know they existed, but never looked at them: 38, 6.9%
Some, but less than 25%: 132, 24.0%
About 25% of the Codex: 45, 8.2%
About 50% of the Codex: 67, 12.2%
About 75% of the Codex: 65, 11.8%
All or nearly all of the Codex: 138, 25.0%
Time in Community (in years since you found it):
6 + 4.7 (2, 5, 10) [n=525]
Broken out into buckets:
>=0 to <=5: 290, 61.2%
>5 to <=10: 143, 30.2%
>10 to <15: 63, 13.3%
>=15 to <100: 29, 6.1%
[I did a little bit of data cleaning here. For instance, I don’t think anyone has been in the community for 2019 years, so I cleaned that to 4. I don’t have an explanation for the outlier that’s been here for 25 years; I think Overcoming Bias started in 2006, and even if you count SL4 that still only gets you to 2000.]
Time on LessWrong (in average minutes a day):
15.4 + 17.8 (5, 10, 20) [n=492]
In buckets:
>=0 to <=30: 452, 91.9%
>30 to <=60: 32, 6.5%
>60 to <=120: 8, 1.6%
LW Karma:
934.9 + 3201.9 (0, 20, 300) [n=418]
Survey Referral:
Where did you find the link to this survey from?
LessWrong: 413, 75.9%
Discord: 91, 16.7%
Bayesian Conspiracy Podcast: 16, 2.9%
Telegram: 5, 0.9%
LessWrong Curated Podcast: 4, 0.7%
Other: 15, 2.8%
I’ll talk about this later, but I think the Bayesian Conspiracy punched above its weight class here.
VII. LessWrong and the Community
Adjacent Communities: Do you consider yourself a member of . . .
Effective Altruism:
No: 201, 37.1%
Sorta: 188, 34.7%
Yes: 153, 28.2%
SlateStarCodex/Astral Codex Ten:
No: 174, 32.0%
Sorta: 184, 33.9%
Yes: 185, 34.1%
Post-rationality:
No: 447, 83.7%
Sorta: 66, 12.4%
Yes: 21, 3.9%
TPOT/ Vibecamp:
No: 464, 87.1%
Sorta: 39, 7.3%
Yes: 30, 5.6%
Guild of the Rose:
No: 480, 89.6%
Sorta: 35, 6.5%
Yes: 21, 3.9%
Glowfic:
No: 449, 83.9%
Sorta: 57, 10.7%
Yes: 29, 5.4%
Forecasting:
No: 274, 51.0%
Sorta: 179, 33.3%
Yes: 84, 15.6%
Community structure has been on my mind a lot lately. Part of this question is useful for suggesting team efforts. ACX and EA have a lot of overlap in membership, though beware the confusion of the inverse. From the Astral Codex Ten surveys (which use basically the same wording) ACX has a basically symmetrical relationship with LessWrong. EA's a little trickier to judge, but I've been happy with every time I've tried working with organizers in a EA/LW/ACX group event.
I'm curious to what extent the others are subgroups vs distinct populations. I haven't seen Guild of the Rose survey data on this question, but my wild guess is that most members of the guild would also consider themselves part of LessWrong. (Someone from the Guild feel free to chime in if you know the answer here!) Everyone in the high school chess club is a member of the high school, but not every member of the high school is a member of the chess club. Once a group gets big enough not everyone knows everyone else, subgroups seem a really promising answer to the challenge of Dunbar's Number as well as a way to dive into more specific interests.
Adjacent Community Write-in:
As with most write-ins, it’s hard to do useful math on this.
AI Safety came up a lot, which surprised me but it shouldn’t have; I don’t think of AI Safety as a community, but I guess I do hear people talking about the Software Engineering Community and the Academic Research community so this can make sense. Given the small size of the field, AI Safety probably is actually a little community like.
The Bayesian Conspiracy came up a lot. That’s probably a selection effect, but the existence of that effect is cause for comment. I tried several different ways to get more people to see and take the census this year, one of which was asking people to share it on their neck of the rationalsphere. I also kept track of who posted things when so I could notice which places worked best. The conspiracy was the most successful of these.
Rationalist Tumblr, I’m glad to see the rumours of your demise were exaggerated! Not very exaggerated, but a little exaggerated.
Attending Meetups:
Do you attend Less Wrong meetups?
No: 328, 60.1%
Yes, once or a few times: 141, 25.8%
Yes, regularly: 77, 14.1%
Organizing Meetups:
Do you organize Less Wrong meetups?
No: 484, 88.5%
Yes, once or a few times: 40, 7.3%
Yes, regularly: 23, 4.2%
Have you ever attended a rationalist-style Secular Solstice?
No: 448, 82.2%
Yes: 97, 17.8%
Physical Community Interaction:
Is physical interaction with the Less Wrong community otherwise a part of your everyday life?
No: 394, 73.0%
Yes, sometimes: 80, 14.8%
Yes, all the time: 66, 12.2%
Romance:
Have you ever been in a romantic relationship with someone you met through the Less Wrong community?
No: 460, 84.4%
They are now: 28, 5.1%
Yes: 57, 10.5%
Guild Question:
If you went to a rationality dojo, what would keep you coming back to it?
This was another write-in, with over a hundred answers. Things that came up a lot include measurable improvement on practical life problems, friends and company, acceptance of beginners, and being convenient to get to. Infrequent but interesting ideas included long running projects, the founder not moving to Berkeley, and “an initiation ceremony like the bayesian conspiracy.” What does that podcast get up to?!
VIII. Probability
Eight people this year said they didn’t read the instructions and were going to make the data weird by using the wrong format. I appreciate your honesty! One of them then used the right format. That person loses honesty points but I do appreciate the extra data point, so I’ll call it a wash. Everyone who said they were going to follow the instructions and then didn’t, may your library card be misfiled.
Reminder: the result format used is "Question: Mean + standard deviation (1st quartile, 2nd quartile, 3rd quartile) [n= number responding]"
P(Many Worlds): 50.1 + 32 (20, 50, 80) [n=428]
P(Aliens): 67.5 + 33.9 (40, 80, 97.25) [n=488]
P(Aliens 2): 31.9 + 34.8 (2, 10, 60) [n=484]
P(Supernatural): 8.6 + 22.2 (0, 0.5, 5) [n=486]
P(God): 10.6 + 23 (0, 1, 5) [n=474]
P(Religion): 7 + 21.6 (0, 0.000001, 1) [n=493]
P(Hippobamapus): 0.9 + 8 (0, 0, 0) [n=513]
P(Time Travel): 3.4 + 10.9 (0, 0.01, 1) [n=478]
P(Cryonics): 22.8 + 27.2 (3, 10, 30) [n=493]
P(Anti-Agathics): 33 + 33.5 (3, 20, 60) [n=492]
P(Simulation): 23.4 + 26.8 (2, 10, 40) [n=442]
P(Warming): 90.9 + 44.9 (90, 96, 99) [n=504]
P(Global Catastrophic Risk): 57.6 + 32.9 (30, 65, 80) [n=493]
P(Mars Train): 46.9 + 33.4 (15, 50, 79.5) [n=459]
P(GPT-5 Release): 56 + 24.8 (40, 60, 75) [n=471]
P(Dow Jones): 67.5 + 37.6 (60, 66, 75) [n=425]
P(LLM Hallucination): 27.8 + 22.1 (10, 20, 40) [n=420]
P(Hamas Rules Gaza): 38.1 + 24 (20, 35, 60) [n=423]
Last year, I asked about the odds shapeshifting lizard people secretly controlled the world. I was expecting this to be a Lizardman Constant of about five percent of the respondents giving absolute nonsense answers due to trolling or misunderstanding the question, and indeed some respondents had odds of lizard people as high as 7%. This year I asked if Barack Obama was secretly a hippopotamus, which I think is even more ridiculous. Two people said this was basically 100% likely, there was one obvious joke of 69.42%, and then a spread of answers trailing downward with clusters at 1%, 0.1%, 0.01%, and other powers of 10 going downward.
I notice I’m confused. Not at why someone would say Obama is certainly a hippo, that’s the Lizardman Constant, but why were the Lizardfolk believers last year so restrained? Nobody put 100% that time. Are the trolls losing their subtlety? They were a lot easier to spot being weird elsewhere than last year. I’m disappointed.
Separately, most of the probability questions are about things we won't know the answers to for a while and might never have a settled answer on. This year I added a few questions whose answers we will know by the end of the year, a couple of which have active Manifold prediction markets. Right now it looks like the LessWrong gestalt agrees with Manifold on Gaza still being ruled by Hamas, and is more optimistic on LLM hallucinations getting solved. I plan to look at this again (along with the Dow Jones question and the GPT-5 question) toward the end of the year and see if anything neat pops out.
This was also a fun place to play with historical data, even if it was a pain to display in a sensible way!
IX. Traditional Census Questions
By what year do you think the singularity will occur?:
2050.8 + 226.4 (2033, 2040, 2060) [n=397]
[As with last year, there were some outliers here but it was a tighter spread. I cut off anyone in the past, and we get this]
2071.3 + 106.2 (2033, 2040, 2060) [n=391]
[There’s still some far future answers, but nobody standing alone where I felt it was obvious to ignore that answer. I tried dropping everyone at 2500 and later to get the following, but you should be aware that this was super arbitrary and I could have nudged the answer higher or lower by picking a different cuttoff.]
2058.6 + 52.2 (2033, 2040, 2060) [n=383]
AI Knowledge Work:
By what year do you think AI will be able to do intellectual tasks that expert humans currently do?
2035 + 26.4 (2026, 2030, 2035) [n=425]
[I tried removing all the answers 2023 and previous, but the people arguing it already happened with GPT have a point about the wording.]
2036.8 + 25.6 (2027, 2030, 2035) [n=394]
[Turns out that doesn’t change much. There’s a pretty smooth curve out to at least 2035.]
Cryonics Status:
Never thought about it / don't understand: 19, 3.6%
No - still considering it: 178, 33.8%
No - and do not want to sign up for cryonics: 152, 28.9%
No - would like to sign up but haven't gotten around to it: 113, 21.5%
No - would like to sign up but unavailable in my area: 40, 7.6%
Yes - signed up or just finishing up paperwork: 24, 4.6%
Calibration IQ:
Odds the IQ you gave earlier in the survey is greater than the IQ of over 50% of survey respondents?
47.3 + 27.8 (27.5, 50, 70) [n=127]
Calibration Question:
What is the weight of the Opportunity Rover in kg?
1070 + 4979.7 (100, 300, 1000) [n=467]
P(Correct within 10%): 22.4 + 18.6 (10, 20, 30) [n=460]
This was a fun one. The rover is 185kg, though the total launch mass was 1063. It wasn’t intended to be a trick question; I asked about the rover.
>=0 to <=166: 147, 31.9%
>166 to <=203: 54, 11.7%
>203 to <1000: 141, 30.6%
>=1000 to <100000: 124, 26.9%
>=10000 to <1000000: 6, 1.3%
X. LessWrong Team Questions
Underrated Contributor:
Duncan Sabien: 9, 8.2%
Me: 7, 6.4%
Said Achmiz: 6, 5.5%
lsusr: 4, 3.6%
Raemon: 3, 2.7%
Screwtape: 3, 2.7%
Valentine: 3, 2.7%
Jenn: 2, 1.8%
John Wentworth: 2, 1.8%
lc: 2, 1.8%
Quintin Pope: 2, 1.8%
Stuart Armstrong: 2, 1.8%
Tailcalled: 2, 1.8%
Trevor: 2, 1.8%
TsviBT: 2, 1.8%
Zack M. Davis: 2, 1.8%
This wasn’t a complicated question, but it made me smile, and not just because I’m on it. There were some more answers but I dropped any where there weren't at least two. Next year I'm strongly tempted to have a place for leaving anonymous compliments for other users.
LW Impact:
What do you think the net impact of LessWrong has been on the world?
Actively good: 397, 83.9%
Neutral: 64, 13.5%
Actively evil: 12, 2.5%
Californian LW:
Have you ever been to the In-Person Californian LessWrong community?
No: 392, 82.5%
Yes, for a few days: 43, 9.1%
Yes, for a few months: 13, 2.7%
Yes, for a few years: 27, 5.7%
Heavy AI:
Has it been good for the world for LessWrong to become extremely heavy in AI alignment content in the past 3 years? 1 is no, 10 is yes.
6.7 + 2.3 (5, 7, 8) [n=452]
Or, in buckets:
10: 45, 10.0%
9: 50, 11.1%
8: 88, 19.5%
7: 88, 19.5%
6: 62, 13.7%
5: 28, 6.2%
4: 35, 7.7%
3: 37, 8.2%
2: 11, 2.4%
1: 8, 1.8%
Best & Worst Thing about LW:
These were a pair of write-ins, and are a pain to do math on. Common answers obtained via me reading the entire list then writing down what I remember came up a lot were
Best:
Good discussion norms, smart people, AI content, the community of people like me, learning new things.
Worst:
Echo chamber, arrogant people, AI content, the community drama, intimidating posts and not a good entry point.
To the person who said the worst thing was you couldn't figure out how to meet these people in person: if this page doesn't help, I'd love to talk to you and learn what the blockers are. Rationality meetups are relevant to my interests these days.
LW Recommendation:
How likely are you to recommend LessWrong to a friend or a colleague?
6.1 + 2.7 (4, 7, 8) [n=367]
10: 30, 8.2%
9: 45, 12.3%
8: 62, 16.9%
7: 54, 14.7%
6: 38, 10.4%
5: 21, 5.7%
4: 31, 8.4%
3: 36, 9.8%
2: 28, 7.6%
1: 22, 6.0%
[Note: On the second day of survey, someone on the LW team asked me to change it to a 1-10 scale instead of the 1-7 I started with, so I did. I experimented with scaling up the 1-7, but I’m not sure that’s valid, so for this I tossed out all the answers to this question that happened before I made the change.]
Sequences Hardcopy:
How many US dollars would you pay for a set of The Original LessWrong Sequences?
$40.6 + $349.1 ($1, $25, $50) [n=309]
Any time I see a standard deviation that’s bigger than the mean, my bucket finger gets itchy.
>=-5,000 to <=-50: 3, 1.0%
>-50 to <=0: 72, 25.0%
>0 to <50: 134, 46.5%
>=50 to <150: 78, 27.1%
>=150 to <500: 17, 5.9%
>=500 to <3000: 4, 1.4%
Yeah, -$5000 would do it. At that price even if I hated them I'd be tempted to take the deal and use the books as kindling for a marshmellow roast and feel I got overpaid, but maybe the respect for the sanctity of books in general prevents that tactic?
HPMOR Hardcopy:
How many US dollars would you pay for a set of Harry Potter and the Methods of Rationality?
37.2 + 87.4 (0, 20, 50) [n=307]
>=-5000 to <=-50: 3, 1.0%
>-50 to <=0: 78, 25.9%
>0 to <50: 136, 45.2%
>=50 to <150: 71, 23.6%
>=150 to <500: 18, 6.0%
>=500 to <3000: 1, 0.3%
The Codex Hardcopy:
How many US dollars would you pay for a book set of The Codex (100 selected essays by Scott Alexander)?
16.7 + 295.8 (0, 20, 50) [n=296]
>=-5000 to <=-50: 2, 0.7%
>-50 to <=0: 75, 27.5%
>0 to <50: 139, 50.9%
>=50 to <150: 68, 24.9%
>=150 to <500: 12, 4.4%
>=500 to <3000: 0, 0.0%
GreaterWrong use:
I have never used it: 296, 60.5%
I've used it once or twice: 175, 35.8%
I go back and forth between GreaterWrong and LessWrong: 9, 1.8%
It's the primary way I interface with LessWrong: 9, 1.8%
Identity:
Rationalist:
5.4 + 1.5 (5, 6, 7) [n=473]
7: 123, 26.0%
6: 129, 27.3%
5: 119, 25.2%
4: 44, 9.3%
3: 32, 6.8%
2: 20, 4.2%
1: 6, 1.3%
Effective Altruist:
4 + 1.7 (3, 4, 5) [n=469]
7: 33, 7.0%
6: 61, 13.0%
5: 114, 24.3%
4: 89, 19.0%
3: 75, 16.0%
2: 51, 10.9%
1: 46, 9.8%
Longtermist:
4 + 1.6 (3, 4, 5) [n=461]
7: 26, 5.6%
6: 48, 10.4%
5: 122, 26.5%
4: 105, 22.8%
3: 67, 14.5%
2: 64, 13.9%
1: 29, 6.3%
Good Person:
4.8 + 1.5 (4, 5, 6) [n=470]
7: 61, 13.0%
6: 112, 23.8%
5: 122, 26.0%
4: 83, 17.7%
3: 52, 11.1%
2: 26, 5.5%
1: 14, 3.0%
Risk-Neutral:
3.1 + 1.3 (2, 3, 4) [n=440]
7: 3, 0.7%
6: 18, 4.1%
5: 39, 8.9%
4: 104, 23.6%
3: 108, 24.5%
2: 115, 26.1%
1: 53, 12.0%
Contrarian:
4.1 + 1.5 (3, 4, 5) [n=457]
7: 21, 4.6%
6: 58, 12.7%
5: 124, 27.1%
4: 108, 23.6%
3: 71, 15.5%
2: 56, 12.3%
1: 19, 4.2%
Bystander:
3.2 + 1.6 (2, 3, 4) [n=450]
7: 13, 2.9%
6: 26, 5.8%
5: 60, 13.3%
4: 83, 18.4%
3: 101, 22.4%
2: 101, 22.4%
1: 66, 14.7%
XI. Questions the LessWrong Team Should Have Asked
Known Features: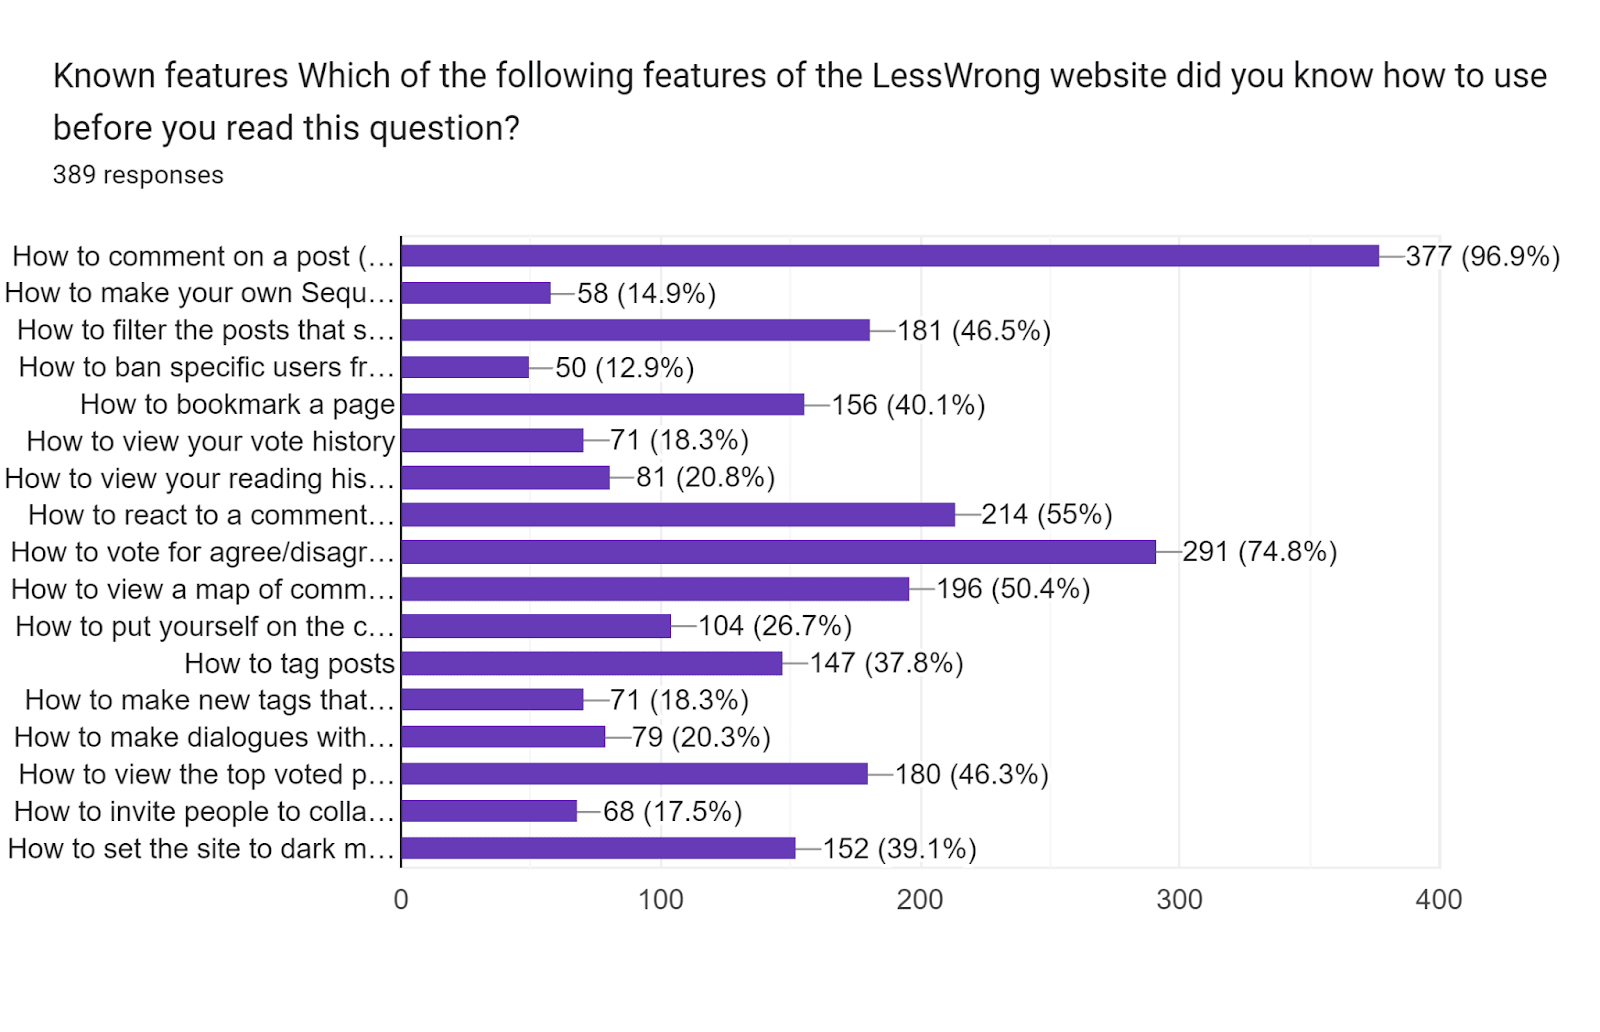
Which of the following features of the LessWrong website did you know how to use before you read this question?
(Making them text so they're searchable later)
How to comment on a post
How to make your own sequences
How to filter the posts that show up on the front page
How to ban specific users from commenting on your posts
How to bookmark a page
How to view your vote history
How to view your reading history
How to react to a comment with emoticons
How to vote for agree/disagree
How to view a map of community events and meetups
How to put yourself on the community map
How to tag posts
How to make new tags that can be applied to posts
How to make dialogues with other users
How to view the top voted posts sorted by week, month, or year
How to invite people to collaborate with you on a draft
How to set the site to dark mode
As the ACX Meetup Czar, the feature of LessWrong that’s obviously pertinent to my goals is the map of community events and meetups. If you click the three horizontal lines (“hamburger menu”) at the top right of the website, it’ll have options like Home, All Posts, and Concepts. Look for Community Events and click that. It’ll show you a map of the world, and if you allow it to access your location it’ll zoom in to the area near where you are. Green arrows are meetups. If there are no green arrows but you’d like meetups to happen near where you are, I have some suggestions on how to run some.
At first glance the main takeaway from this was that LessWrong could be better about explaining its features. I still don’t actually know how to ban users from my posts. That said, remember that about 40% of respondents had never made a single post. Since “New Dialogue” is right below the “New Post” button but only ~20% of users know how to use it, I don’t have actual advice.
Bonus: While reading these results, one of the LessWrong team members asked me if the people who knew how to view their reading history were making things up, because he didn't remember that feature. When writing this survey I had been tempted to include some ridiculous feature that didn't exist as a joke. That was how I learned LessWrong actually does have a dark mode option.
LessWrong Feature List:
This was a write-in, so I’m just going to cherry pick a few either because they came up a lot or because I personally liked them.
I have another feature request that I write as I finish editing this results post shortly before release: Fix whatever bug it is that means when you copy a document from Google Docs into the LessWrong editor the line breaks get all messed up. Please? I had to fix a lot of line breaks.
LessWrong Norms:
Basics of Rationalist Discourse:
Strongly Like: 57, 24.3%
Like: 107, 45.5%
Neutral: 53, 22.6%
Dislike: 12, 5.1%
Strongly dislike: 6, 2.6%
Elements of Rationalist Discourse:
Strongly Like: 60, 26.4%
Like: 99, 43.6%
Neutral: 56, 24.7%
Dislike: 10, 4.4%
Strongly dislike: 2, 0.9%
FGD Basics of Rationalist Discourse:
Strongly Like: 57, 24.1%
Like: 74, 31.2%
Neutral: 64, 27.0%
Dislike: 27, 11.4%
Strongly dislike: 15, 6.3%
SSC Comment Policy:
Strongly Like: 62, 26.8%
Like: 75, 32.5%
Neutral: 75, 32.5%
Dislike: 14, 6.1%
Strongly dislike: 5, 2.2%
I wish I’d included some kind of placebo discussion norm. This looks like people are in favour of norms, though not in favour of profanity.
XII. Indulging My Curiosity
Most Used Lesson:
What is the lesson from Rationality that you have most internalized and use most often?
Belief in Belief: 3
Conservation of Expected Evidence: 5
Bayesion Reasoning: 5
Human’s Guide to Words: 4
Litany of Tarski: 3
Litany of Gendlin: 4
Making Beliefs pay Rent: 14
More Dakka: 2
I notice I am confused: 14
Noticing: 2
Multiagent Models of Mind: 2
Murphyjutsu: 2
Neural Categories: 2
Outside View: 2
Planning Fallacy: 5
Stop and Actually Think For 5 Minutes: 4
Taboo Words: 2
The Categories were Made For Man, Not Man For The Categories: 2
The Map is not the Territory: 5
There were also a bunch of answers that were probably about thinking in probabilities, but since they phrased it a lot of different ways I’m not sure how many people picked that. My 90% confidence interval is it’s between 4 and 12.
Some people quoted HPMOR directly, which is a good way to make me think fondly of you.
“Hesitation is always easy, rarely useful”
“Some of them were silently crying, but they were still writing. Continuing to fight was also a lesson Professor Quirrel had taught.”
Most Wanted Ratfic:
Here’s a collection of suggestions that got multiple submissions:
Ender’s Game
Death Note
Eragon
Dr. Who
Stargate
Star Wars
Star Trek
Dune
Accelerando
Animorphs
Bobiverse
Buffy the Vampire Slayer
Lord of the Rings
Scholomance
Mother of Learning
The Promised Neverland
Ender’s Game, Death Note, Star Wars, Star Trek and Dune were the clear tops.
Here’s a collection of things people wanted that I know have rationalist fiction adaptations. Those versions may not be your cup of tea, but if you were unaware of them allow me to do my part in adding to your reading list :)
Twilight
Terminator
Animorphs, with an audio version in progress. (Disclosure: I'm the editor for the audio version.)
I now have a wonderful, horrible idea for Ender's Game fanfic that this margin is too small to contain.
There’s also glowfic of lots of this. Your mileage may vary.
Favourite Tactile Sensation
This was a write-in and all over the place. Consider this a rabbit hole I hope to give its own smaller post to at a later date.
Most Important Community
What is the most important community in your life?
These were write-ins. I did my best to group them reasonably, but in lots of places I just made a judgment call. Anything listed incremented its group. First there’s the big rationalist groups:
EA:16
ACX: 1
LW: 1
Rationality:33
AI Safety: 5
Glowfic: 6
Then there’s the niche rationalist groups:
Cooperative Conspiracy: 1
Guild of the Rose: 1
University of Bayes:1
The Motte:1
TPOT: 1
[Why do I count ACX as a big rationalist group despite only one response? I’m arbitrarily guessing that when people said Rationality, they included ACX and LessWrong. Only two people mentioned LW or ACX directly. It probably makes the most sense to just add those to the Rationality total.]
Then there’s a collection of other groups.
Family: 40
Unspecified Friends: 22
School friends: 11
Queer/LGBTQ+: 9
D&D/TTRPG friends: 5
Church: 5
Other Games: 4
Work: 4
Political Group: 3
Fandom:2
Last, there’s the largest community:
Humans:3
And then there were a bunch of things that only got one person suggesting them, though plausibly there’s a decent sized group of “Special interest” that would include, say, Computer Security and Dance and Physics. Likewise there were a run of answers suggesting different specific online communities.
The AI Safety community continues to surprise me. I wouldn’t have thought it could have that community role in someone’s life: it’s not wrong to say I’m a member of the “Software Engineering Community” since I used to be a straightforward programmer, but I tend to put that in a very different mental bucket from say, my D&D group or my old church.
Random Numbers:
Pick a random number between 1 and 100, inclusive. Do not use any external random generator, just use your brain.
Generated Numbers: 50.8 + 26.7 (29, 48, 73) [n=439]
Using the same probability format as before, what is the probability that a randomly selected respondent gave the same number you did?
P(Same Number): 6.4 + 16.4 (1, 2, 5) [n=415]
Imagine a balanced die with a hundred sides, labeled 1 to 100. I roll it once, and get 23. Before I roll it a second time, I pause to consider what the odds are that it will land on 23. This should be one in a hundred, or 1%. Now replace the balanced die with making up a random integer in that range in your head, then asking the person next to you to make up a similar random number. Since people aren’t good at random generation, we expect some patterns in what numbers will come up. I’ve been curious about the patterns ever since reading this XKCD.
I still think this is a neat game. When I try to make random numbers, I have to fight my inclination to go both towards and away from the “obvious” schelling answers. About one in a hundred people should randomly land on say, 42, and then have to think about how many people who aren’t good random generators either avoided 42 or went towards it.
In practice there’s a lot of weirdness and I’m strongly tempted to use this as another Lizardman Constant check, even though I can’t eyeball a connection between the Hippobamapus people and the weird answers to the random numbers. 4 people had probabilities 99% and up. Even if everyone was actively trying to coordinate on the same number, that's way too high. 43 people had odds over 10%, and while some of them are on decent picks for Schelling numbers some of them aren’t, or at least not anything I recognize.
The modal (e.g. most commonly picked) number was 37, which 4.4% of answers gave. Somehow people seemed to know this; only one person who picked 37 thought there was a <1% chance a random other person would pick that number. To the four people who picked 37 and thought there was a 5% chance other people would also choose it, well played.
P(Global Catastrophic Risk and Global Warming):
53.2 + 34 (22.5, 60, 80) [n=363]
Many of you commented that you saw what I was doing here. The Conjunction Fallacy is when adding more detail to a prediction makes it seem more likely, despite being less objectively likely. Remember, the odds for the individual questions were:
P(Warming): 90.9 + 44.9 (90, 96, 99) [n=504]
P(Global Catastrophic Risk): 57.6 + 32.9 (30, 65, 80) [n=493]
This wasn’t a very good example of the conjunction fallacy. The two don’t tell a good story together. Intuitively the places where the conjunction fallacy are strongest are when it feels like part of this is an explanation. (Consider “Bob gets fired” and “Bob does poor work and then gets fired.” The latter has to be lower probability than the former, since sometimes Bob gets fired despite doing great work, and every time Bob gets fired for doing poor work Bob still gets fired.) Also, I asked you all the questions instead of asking some people the combined form and some people half of it. Still, the combination of the two was lower on average, which is the way it’s supposed to go. It didn't look uncommon for people to miss this on an individual level though.
Random Weirdness:
In your own opinion, does your life contain the right amount of mysterious old wizards dropping hints about transformative and/or perilous quests?
It should have more mysterious old wizards: 323, 74.4%
It has about the right amount of mysterious old wizards: 92, 21.2%
It should have less mysterious old wizards: 19, 4.4%
Years ago, I remember people talking about how the EA community needed more of certain skills, and then a bunch of people learned those skills, and now the lack isn’t as apparent. (I think this was ops related things?) Now we’re faced with the question: how does one train more wizards? How tractable are letters to Hogwarts?
XIII. Detailed Questions We’ve Asked On Previous Surveys
Well, mostly things we've asked on previous surveys. Blood Amount and Kidney Donation are new.
Income:
What is your approximate annual income in US dollars?
$91,983.3 + $10,5612.6 ($20,000, $60,000, $130,000) [n=277]
Charity:
How much money, in number of dollars, have you donated to charity over the past year?
$10,732.7 + $116,676 ($0, $100, $2,000) [n=298]
Height:
180.6 + 81.8 (172, 178, 183) [n=369]
Have you ever donated blood?
No: 262, 58.4%
Yes: 187, 41.6%
Blood Amount:
About how many times have you donated blood over the course of your life?
6.2 + 12.7 (0, 1, 6) [n=283]
Kidney:
Have you ever donated a kidney?
No, and I haven't tried/don't want to: 433, 97.5%
No, but I tried: 10, 2.3%
Yes, to a stranger: 1, 0.2%
Diet:
Do you follow any dietary restrictions related to animal products?
No: 227, 50.8%
Yes, I restrict meat some other way (pescetarian, flexitarian, try to eat only ethically sourced meat): 111, 24.8%
Yes, I am a vegetarian: 44, 9.8%
Yes, I am a vegan: 32, 7.2%
Yes, I only eat kosher food: 7, 1.6%
Other: 26, 5.8%
Primary Language:
English: 331, 70.7%
German: 43, 9.2%
Russian: 22, 4.7%
French: 19, 4.1%
Dutch: 5, 1.1%
Finnish: 5, 1.1%
Polish: 5, 1.1%
Spanish: 5, 1.1%
Danish: 4, 0.9%
Italian: 3, 0.6%
Norwegian: 3, 0.6%
Other: 23, 4.9%
[Something weird kept happening with German where it showed up three times. I summed them together, assuming it was some kind of string equivalence issue, but it was weird.]
Number of Languages:
In how many languages do you consider yourself fluent?
1.6 + 0.7 (1, 1, 2) [n=460]
1: 250, 54.3%
2: 172, 37.4%
3: 27, 5.9%
4: 9, 2.0%
5: 2, 0.4%
XIV. Bonus Politics Questions
Level of Interest in Politics?
3.3 + 1.1 (2, 3, 4) [n=454]
5: 66, 14.5%
4: 147, 32.4%
3: 114, 25.1%
2: 101, 22.2%
1: 26, 5.7%
User Tailcalled had an array of politics questions they’ve apparently arrived at through extensive use elsewhere. Since I generally regard talking politics as a waste of time except in very unusual circumstances, you’re going to have to rely on Tailcalled for any analysis here.
TC1: 3.3 + 1 (3, 3, 4) [n=373] (“Companies that focus on profit buy up and reduce the wages of companies that try to pay workers more”)
TC2: 3.3 + 1.1 (2, 3, 4) [n=386] (“The stock market fails to punish powerful people for poor investments because people in power just get the government to bail them out using taxpayer money.”
TC3: 2.8 + 0.9 (2, 3, 3) [n=384] (“The government has regulations that make financial markets work well and fairly.”)
TC4: 2.0 + 0.9 (1, 2, 3) [n=394] (“The government knows well how to balance costs and benefits.”)
TC5: 3.2 + 1.3 (2, 3, 4) [n=398] (“Academia has been taken over by a woke culture which suppresses dissent.”)
TC6: 3.2 + 1.3 (2, 3, 4) [n=398] (“Minority groups tend to be biased and favor wokeness over fairness.”)
TC7: 2.8 + 1.2 (2, 3, 4) [n=397] (“You can see from the gender ratios in income and work areas that there's still tons of sexism around.”)
TC8: 3.9 + 1.1 (3, 4, 5) [n=404] (“Climate science is critically important due to global warming.”)
TC9: 1.6 + 0.9 (1, 1, 2) [n=400] (“One of the greatest benefits of art is that management can place it in workplaces to set a calming, productive tone.”)
TC10: 3.1 + 1.1 (2, 3, 4) [n=393] (“Brand reputation is the main way consumers know that products are safe and high-quality.”)
TC11: 3 + 1.1 (2, 3, 4) [n=394] (“Fashion is a good way to build confidence.”)
TC12: 2.1 + 1 (1, 2, 3) [n=393] (“Democratic elections are basically polls about who you trust to lead the country, so democratically elected leaders are considered especially trustworthy.”)
TC13: 3.9 + 1.1 (3, 4, 5) [n=403] (“Teaching will need to start incorporating AI technology.”)
TC14: 4.6 + 0.6 (4, 5, 5) [n=400] (“Genetically modified organisms will make farming more effective in the future.”)
TC15: 1.5 + 0.8 (1, 1, 2) [n=408] (“AI cannot replace designers as computers lack creativity.”)
TC16: 2.6 + 1.3 (2, 2, 4) [n=404] (“Elon Musk's project of colonizing Mars is a useless vanity project.”)
TC17: 2.3 + 1.2 (1, 2, 3) [n=395] (“To save the environment, people should eat seasonal locally grown food instead of importing food from across the world.”)
TC18: 2.6 + 1.3 (2, 2, 4) [n=407] (“Claims that it's soon the end of the world are always hyperbolic and exaggerated.”)
TC19: 4.5 + 0.8 (4, 5, 5) [n=407] (“It is important that the news is run independent of the government so it can serve as a check on those in power.”)
TC20: 1 + 0.2 (1, 1, 1) [n=423] (“The moon landing was faked.”)
Politics Open Section:
Being a write-in, this is going to be hard to do numbers on. There’s a lot of “liberal, but-” and “libertarian, but-” going on. Here’s a few answers that stood out to me, cherry picked purely based on my personal amusement.
“Blood-choked, guttural screaming”
“The government should do good things and not bad things”
“My condolences to the entire US”
“just let people fucking do things”
“dath ilan”
“Sad”
“What's ‘politics’?”
XV. Wrapup
Census Length:
How long was this survey? (1 means happy to answer more, 5 means way too long)
3.2 + 1 (3, 3, 4) [n=477]
5: 31, 6.5%
4: 174, 36.5%
3: 168, 35.2%
2: 77, 16.1%
1: 27, 5.7%
Have you answered this survey honestly and accurately?
Yes: 509, 100.0%
I love this question. People sometimes think Obama is a hippo. People sometimes admit they don’t read the instructions. But everyone answers survey questions honestly.
Census Meta
The Census Over Time
Age
One of the things I’m curious about is how the community ages. Remember that chart from earlier?
[I forgot to label my axes. Horizontal is the age of the respondent, vertical is the number of people who gave that response, each line represents the answers from a specific year's survey.]
Imagine if, back in 2011, a hundred people found LessWrong, all coincidentally one year apart in age. There’s a single newborn, a single one-year-old, a single two-year-old, ect, all the way up to someone who just turned a hundred years old. Except, in this hypothetical, there’s two people who were twenty. If everyone took the survey every year, we’d see a bump move from twenty to twenty one to twenty two, right on schedule. My question is, are we basically the same people, just growing older, or are we adding and losing people at particular ages?
Across all survey years, LessWrong is most popular with people in their twenties. That seems clear via the extremely scientific analysis of “hot damn look at that chart.”
There’s probably a better way to hunt for the moving cohort than visual inspection, but I’m going to try zooming in on the 18 to 30 range so I can look closer
[I forgot to label my axes. Horizontal is the age of the respondent, vertical is the number of people who gave that response, each line represents the answers from a specific year's survey.]
That pair of moving cohorts jumped out at me when I first looked at the 2011 and 2012 surveys, which is part of what put me on this track in the first place. (Look at the spike of 21 and 23 year olds in 2011, then the spike of 22 year olds and 24 year olds in 2012.) Ultimately, I don’t think I can determine if there are or aren’t these cohorts just by looking at the chart, and despite the hours I spent trying to turn this intuition into math I don’t have anything to show for it. I do have something else to look at however.
Here I stop using absolute counts of respondents, and instead use the percentage of people who answered. In theory that eliminates a lot of the noise from different years getting different numbers of responses. This is another example of my patented method of survey analysis, “hot damn look at that chart!” Something changed in the age breakdowns between 2016 and 2022. I can’t see a trend between 2011 to 2016, but at some point in the last five to ten years the community started getting older.
Or this is confounded by something. I’m suspicious that the two surveys I ran have such a different distribution, even though it might genuinely be the normal passage of time. It looks like there was a little drift older happening before the gap years, but it's not pronounced and obvious.
I can guess that a high school Rationality club would have some legs, a college group would do better, but the main time people used to be on LessWrong is right after college except in 2022 and 2023 when things pick up in the late twenties. That five year gap in the surveys between 2016 and 2022 is a blind spot.
IQ
A long time ago
in a galaxy far, far awaythere was a lot of debate about the IQ numbers in the census. If you’re not used to reading IQ numbers, these are high enough that people used to argue they had to be wrong somehow, and not without reason. If you ever see a subpopulation mean two standard deviations away from the population (IQ is usually defined with the mean at 100 and a standard deviation of 15) you’re seeing something weird happen. Scott’s attempts to check those numbers was one of the things that made me smile when I was reading his analysis of the LessWrong census, so I thought I’d check how we’re doing.[Axis labels: The horizontal axis is the year of the survey, and the vertical axis is the IQ.]
When I first looked at that graph I had no explanation for the sudden drop, but then I realized the missing years between 2016 and 2022 got me. I think what we’re looking at is a bit of a bump in 2022 (possibly due to the smaller sample) and then a return to where we were in 2016. Is that a just-so story? Eh, possibly.
Gender
Out of curiosity, I ran this tool over the past surveys I had access to as well. The following chart ignores everything besides the four options that have always been on the census.
[Axis labels: horizontal is the percentage of responses that gave the answer, horizontal is the year of the survey, and the lines show the changes in percentages over the years. Well, they would show changes in percentages if there was more than a slight wiggle.]
For this chart I ignored anyone who didn’t answer (or gave an answer that wasn't in all the years of the census) and looked at percentage of the responding population. In other words, each year should sum to 100%, and the lines show how the percentage who read that much changes over time. For some charts like this I would drop answers not many people gave just to have fewer lines visually cluttering up the chart.
Political Short Answer
[I had to do a couple small judgment calls here, most of which involved ignoring the descriptions that used to follow these. The options available have changed over the years, with the original set being Libertarian, Conservative, Liberal, Socialist, and Communist. Socialist got changed to Social Democrat in 2014. By 2022, there were more options on the menu (including by mistake the ability to write-in whatever you wanted in Other.) To make the chart easier to read, I dropped Reactionary, Christian Democrat, Green Party and Syndicalist from the display; their lines basically look like Anarchist but smaller.]
Despite my habitual frustration with all arguments political, I was looking forward to this one. At least in my spheres, people talk a lot about how the political environment is very different in a post Obama, post Trump world or about how the next generation is very different politically. Is the wiggling around of Social Democrat a big deal, especially considering that it’s probably trading places with Socialist in 2014 and it was badly hit by the mistake allowing write-ins for 2022?
Oh, and I didn’t restrict this to Americans, which means that what counts as “liberal” is going to vary based on local politics. How about if we ignore everyone who isn't an American?
[2011 and 2012 didn't have a Country column for me to work with, so they get dropped.]
What am I looking at? If you only pay attention to people from the USA, you have more social democrats and fewer libertarians? I double checked, and yes, I used equals instead of not equals in my query.
Highest Degree
[The horizontal axis is the year of the survey, and the vertical axis is the percentage of people giving that response if you ignore all the Other answers.]
Some questions have easy answers, like what’s up with the high percentage of people answering none in 2011? Answer: Apparently there wasn’t an option for High School before 2012, and when that’s added people switch en mass.
The Sequences
The historical view on how much of the sequences people have read is weird.
I think most of the weirdness is needing to keep the top label in mind; the top of the chart isn’t 100%, it’s 40%. My guess is 10% jump from 2016 to 2022 represents a selection effect where fewer people found the survey, and the ones who did were disproportionately likely to be really into Less Wrong.
I find this question especially interesting. As I talk about in The 101 Space You Will Always Have With You if you’re not making a deliberate effort otherwise, you gradually wind up with less and less people in a group knowing the foundational information the group supposedly cares about. If this chart isn’t just selection effect but actually represents the people reading LessWrong and going to meetups, and the information we care about is in The Sequences, then we want to turn people who haven’t read it into people who have. This chart looks like a mild success to me.
(People might reasonably disagree with those two premises. Certainly I think some of this is selection effect..)
Time in Community
Each line is a year of responses. The horizontal axis is how many years they said they’ve been around. The vertical axis is what percentage of respondents said that many years, ignoring months. (E.g. if you said you’ve been around for a year and a half, you count in the one year bucket.)
I spent a bunch of time trying to figure out the best way to look at this in chart form. (Doing it by count had too much noise from the number of respondents.) I also spent some time trying to clean the data up, since there’s several different formats this question has been asked in over the years that I don’t think change the responses, just how the computer parses them. (“How many months have you been in the community” vs “How many years have you been in the community” plus what I think was something like “In what year did you join the community?”)
The gradual flattening of the lines makes sense to me. If someone was around in 2011, then even counting Overcoming Bias only gets you five years in the community. The longer we last, the more it’s even possible to have people who’ve been here for ten or twenty years. Since this is percentages, not a count, increasing percentages of old hands necessarily decreases the percentage of newcomers. Like Age, I can try and follow a cohort and that spike at five years in 2012 looks really interesting; in theory they should reappear at 15 years for 2022, but instead there’s the spike at 16 years in 2022 that moves forward into 2023. Do we have an off-by-one error somewhere, or are those spikes unrelated?
The missing years frustrate me.
Meetups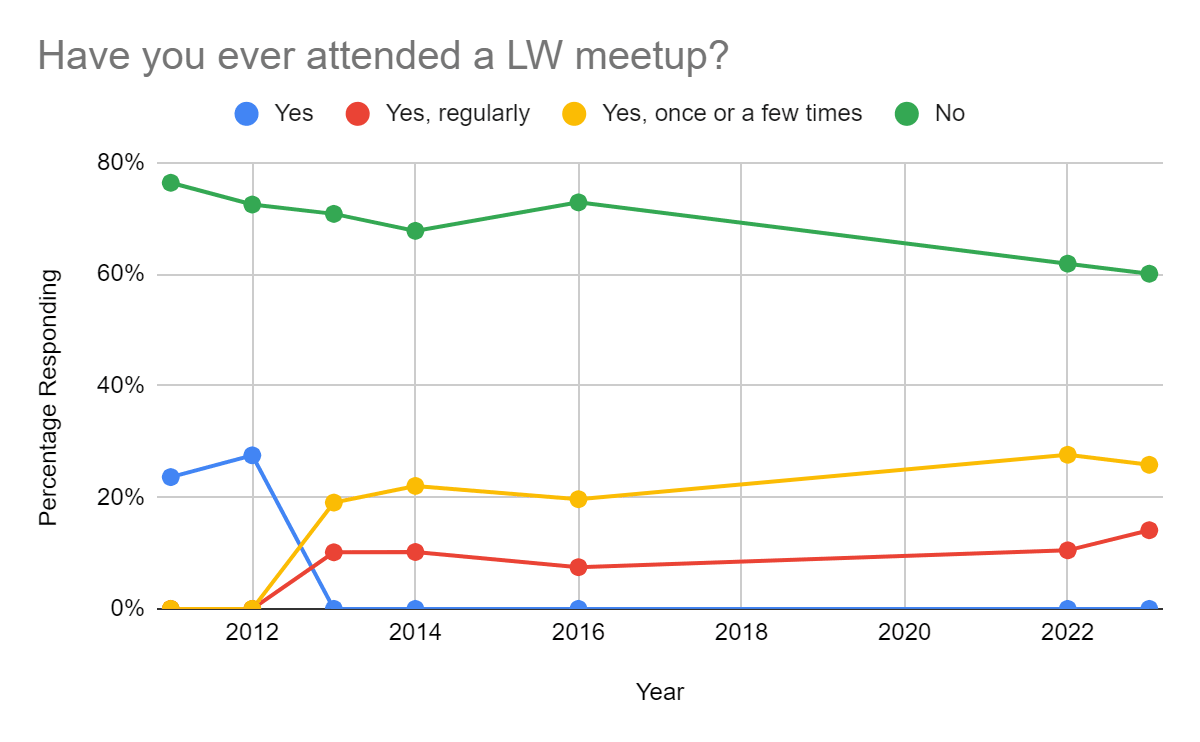
Well there’s a few basically flat lines if ever I saw them. The options changed in 2013 to distinguish regular attendance from going a few times, which is why the simple “yes” line drops off.
Cards on the table, I’m the Astral Codex Ten Meetup Czar. LessWrong meetups are not my domain, but there’s some obvious overlap. If there had been a sharp upward jump in the number of Yes answers between 2022 and 2023, I would absolutely have taken that as a bit of evidence I was having an impact in the Rationality Meetups world. Not overwhelming evidence! There were lots of variables, it could easily have been the payoffs from previous years, random noise, etc. Still, that’s a small nudge in the direction I’ve been working on but not something to brag about.
The conclusion I draw from this comparison is that nothing anyone has tried in the last ten years has made a significant difference in the percentage of people who go to LessWrong meetups. I was extraordinarily tempted to defy the data on that when I first looked at it, but upon reflection I’ve come around to believing it. Scaling in-person events is just inherently going to scale worse than people visiting the website, and most of the people trying are working on their local groups.
Referral
[This count was a little different than the one I used above in the Data section. Mainly, I tweaked the count to catch all the mentions of SSC and ACX, which moved things like "don't remember, probably SSC" from counting as "Other" to counting as "Astral Codex Ten." Still, I'm a little suspicious of how big ACX jumps when I count differently.]
This one is also highly relevant to my interests. HPMOR continues to be outstanding as a source of referrals and it's still creating new referrals. I didn't bother putting "Other Fiction" on this chart even though it's been an option, because even when it's an option it brings in about 1% of answers. If the LessWrong team asked me how to drive more traffic to the website, my answer would be to get Yudkowsky to write another popular fanfic and mention LessWrong in the author's notes.
I haven't looked into it deeply, but as far as I know none of the other rationalist fanfictions have nearly the same kind of presence in their fandoms as HPMOR. HPMOR has a wikipedia page where Hugo award-winning authors praise it. HPMOR kept winding up on most-read lists for fanfiction sites. I once wound up on a date with a lovely woman who wasn't at all interested in LessWrong, but had read lots of Harry Potter fanfic and had read HPMOR.
I can think of lots of good rationalist fics. Is the reason Friendship is Optimal or Metropolitan Man or Animorphs: The Reckoning don't show up like this because they don't have that kind of presence in fandom, or something else? I'm seriously tempted by the explanation that it's the call to action: HPMOR had, in the author's notes, "don't forget to visit LessWrong dot com" which is how I remember finding the site, but I just checked Fanfiction dot com and apparently that's only in one or two author's notes? Though Yudkowsky was also using the pen name Less Wrong for the story, which might have helped. I don't habitually google fanfiction authors' pen names to see if they're also websites though.
More seriously, I don't think the next move is just to write fanfic. I think HPMOR hit a genuinely different audience, one that wasn't accessible to blog posts on an economic professor's website. Most of the audience that can be reached by Harry Potter fanfic probably has been reached. If there's a rock musical burning in your heart about the power of Bayes, or a viral videogame which trains good thinking, maybe that's what would open up new roads to LessWrong. I've run into people who found the community when a friend of theirs brought them to Secular Solstice. It might be the call to action and the outsized presence though.
Any rationalist fanfiction authors out there want to perform an experiment? It only involves a quick link in some authors' notes
and writing fanfic so good it gets its own wikipedia page.Probability
Heads up: The data I have for 2016 doesn’t label its probability questions. The headers look like “ProbabilityQuestions[1]” and “ProbabilityQuestions[2]” but don’t tell me what order they’re actually in. I know there’s twelve of them, and the first is almost all 50% for everything. I am making the assumption that they’re the same questions in the same order as previous years.
Pay close attention to the scale. I let software decide where to set the ranges, which means these charts will jump around from being the full 0 to 100% to being between 0 and 1% if there wasn’t a lot of consensus.
I couldn’t come up with one obviously best way to show what’s going on. After a lot of messing around with graphs and charts, there were two ways to display things that I settled on.
In this one, I bucketed the answers into ten groups and gave each group its own line, with the vertical axis being what percentage of answers fell in that group. Here for instance, in 2023 about fifteen percent of people said many worlds hypothesis was between 90 and 100% likely to be true. Sometimes there’s weird swings in particular percentages; for instance for Many Worlds the confident believers have a steep drop and then a rise over the years, while there’s less overall swings in the moderate doubters (the 40-49% bucket.) This was useful for eyeballing if there were particularly popular ranges; for Many Worlds there’s a fairly balanced mix of everything. If you look at Aliens, you see one particular grouping stood out.
The other view I liked was this, where instead of buckets I used 1st, 2nd, and 3rd quartiles as lines. This makes it harder to spot where a one group had heavy agreement, but it is a lot less visually tangled (fewer lines, and they never cross) and it gives a sense of where there’s a wide spread and where there’s more agreement. Compare P(Many Worlds) (where anywhere from 20% to 80% was within the common range) to P(Supernatural) where there was a very heavy concentration under 5%.
This is one of the charts that showed me something I wasn’t spotting by looking at the raw data or the mean and standard deviations. There’s a large population of responses that are very sure there are aliens out there somewhere, and the mean is the result of a tug-of-war between these people and the other buckets. The second largest group is usually the 80-89% bucket, which suggests to me at least there is a believable gradient here.
I’ve decided I like these buckets as a way to look at collective probability answers. A question where the two largest groups are those very sure the answer is no and those very sure the answer is yes, with all the other buckets in the middle being smaller, feels very different to me than where the largest groups are in the middle even if the mean is the same.
[Note that this is still on the scale where 1 means 1%, something that happens once in a hundred times.]
TL:DR: LessWrong generally thinks the supernatural, God, and religion are unlikely. I’m curious though. These answers put God as pretty much strictly less likely than the supernatural. That makes sense, since God is supernatural. These answers put Religion as pretty much strictly more likely than the supernatural. Which religion claims nothing supernatural at all happened?
This is a question whose answer I want to keep an eye on over time. I don’t expect the next hundred years to give us any new insights into whether God exists, and I wouldn’t expect the next ten years to give us much in the way of new updates as to whether aliens exist, but if cryonics does work I’d expect a slow rise over time as the tech got better and better. Maybe that’s wrong though; if I imagine a similar survey of whether powered flight and airplanes would ever work that graph would have had a very sudden and unexpected spike in 1903.
That looks like a line you’d expect to see if new evidence was gradually showing up making people more and more confident in something. Which isn’t to say that I’m not confused.
(A brief note to reiterate that I am not a statistician by training (I had a couple of undergrad courses in stats I think) and so my confusion is personal and suggestions for how to resolve it are explicitly invited.)
Firstly, why is the 90-100% bucket going up but 80-89% and 70-79% mostly aren’t? Where are people switching from? This makes me suspicious I’m screwing up how I’m producing this chart. I can’t see where the added percentage is coming from.
Secondly, is there new evidence gradually showing up? If I just eyeball that mostly-linear-looking line, it suggests everyone on LessWrong will believe global warming around 2037 and nobody would have believed it around 1980. That linear extrapolation is probably nonsense, but something happened to shift 20% of the responses.
Here, it mostly looks like the bottom is disappearing. There's always been people very sure global warming was going on, but the people who disagree have for one reason or another changed their minds or stopped responding.
This question very much should be moving over the course of decades. After all, it’s specifically that we make it to 2100 “without any catastrophe that wipes out greater than 90% of humanity” and even if nothing changes in the world, every year you have less uncertain time that things can happen in.
This question is a frontrunner for the questions I want run every year in exactly the same configuration, because I want to watch it move in response to the advancement of time with no question that it changed because of question phrasing or bucketting. (There was a change from P(xrisk) to P(Global Catastrophic Risk)) Which makes it unfortunate that the heading is at odds with the description. (A 100% chance of a catastrophe means that the human race will not make it to 2100 without a catastrophe.)
Singularity Year
Wait, what?
The question text is basically the same year to year, with the only difference I noticed between any versions being when to leave the question blank. This is a numeric question without any of the judgement calls I make elsewhere about how to bucket things. And yet the median answer in 2022 is lower than the 1st quartile in 2016, and the 3rd quartile in 2022 is lower than the median in 2016. Also, what is up with the 3rd quartile staying perfectly at 2150 for five surveys straight? I'd expect it to wiggle around a little bit like the 1st quartile does. I was suspicious I was screwing up the data query somehow, but I checked a few of the previous Results posts and saw the same 3rd quartile.
This makes directional sense to me. In 2016 if you look back at the last five years in AI advancement, there aren't that many resources being thrown at this or many rapid public advancements being announced. In 2023, yeah, the last five years feels like a wild ride and maybe the singularity went from something your grandkids would have to deal with to something that's going to happen in your lifetime.
Along with Global Catastrophic Risk, this is one of those questions that's really neat to look at how it changes over time.
Census Referrals
I made a bit of an effort this year to advertise the LW Community Census more.
This was largely opportunistic: over the course of this year I’ve talked to a lot of rationalist groups and a lot of rationalists with a following. Over the course of December, I asked some of them to announce or link to the census. Then comes the slightly sneaky bit.
I asked different people at different times, kept an eye out to see if they did announce it and what day that announcement went out at, and watched the graph of census takers over time. If it spiked noticeably after a particular announcement, that was evidence I should focus on those places if I want to get a message out to the LessWrong community.
Here's a graph of last year's response timings.
Here’s a graph of when this year's responses came in.
The red line is the total signups, the blue line is how many signups happened on that day.
So here’s the part where I get totally baffled. Look at 2023. See that rise on December 28th towards the end? That’s LessWrong putting a banner on the front page. I don’t think literally everyone who visited LessWrong over those three days saw the banner, but most of them did.
See that rise at December 11th?? That’s when a couple of podcasts advertised it, specifically The Mindkiller and The Bayesian Conspiracy. Notice how that spike is bigger than the spike from LessWrong’s banner. The LW Banner spike lasted longer, but as best I can make out they got a similar number of total responses and the day after the advertisement The Bayesian Conspiracy is almost twice as large.
See the other rises? No, you don't, nothing else got a detectable bump and I knew when to look. Random noise trumped the other announcements.
Three hypotheses occur to me. First, there’s a disadvantage to going later; if someone would have taken the census either because The Mindkiller announced it OR because LessWrong put up a banner, then to this test they look like a point for podcasts because the podcast happened first. Second, we're primarily an online community; I forgot that despite my personal focus on meetups it's easier for an announcement vector that doesn't care about geography to reach a lot more people. Third, Eneasz Brodski’s velvet voice is like hypnotic dark honey and those who listen to it become compelled to help when he asks.
Dear LessWrong team: I know autoplaying music on websites is a dated and shunned piece of web design, but have you considered that getting the voice of Harry James Potter Evens Verres to read your banner announcements to everyone visiting the site would be really funny?
Conclusions
About the Respondents
Last year I took a moment to talk about the median LessWronger.
That is all basically still true and still applies. I was in the middle of a rabbit hole trying to figure out the query that would tell me what the least common LessWronger looks like, but finally managed to pull myself out of the series of interesting rabbit holes I kept falling into and published this results post before I figured it out.
A more productive (though still unfinished) rabbit hole I went down was trying to determine how many rationalists there are and how many there could be. To borrow another term from my old day job, what's the total addressable market (TAM) of rationality? Hopefully I'll flesh out some assumptions and made up numbers in a future post working on that.
About the Survey
Last year there was an indication that people thought the survey was a little too long, and I added more questions than I removed, and then more people thought it was too long. Fair enough, message received.
The official status of the survey amuses me. Historically the survey hasn't been run by site administration, but by users. The most consistent run was by Scott Alexander, who started the tradition. Last year I was asked by the admins to make it clear this was unofficial, which I did. This year I kept the "unofficial" label, but also asked the admins to banner it, which they did. Personally I like the census being able to ask weird questions that a typical website survey would never do, but LessWrong isn't a typical website.
I'm interested in is how to get response sizes into the 1~2k range again. My two main approaches are to keep in mind the online nature of the community next time I go knocking on doors asking people to share the survey, and to keep trying to be a familiar username over the course of the year. It's also useful to tweak question phrasing in ways to make it easier to cross compare with larger surveys in the adjacent community.
To me, this felt like a basically successful revival of a LessWrong tradition I enjoyed. Thank you to everyone who took the time to fill it out.
Further discussion of future surveys I'll take to the comments.
The public data
For the public dataset, I made the following changes:
The public data is reachable here. If you do your own analysis and get different answers than I did, it's likely either because I made a mistake or because enough respondents didn't want to be in the public dataset to make our answers diverge.