In light of Anthropic's viral "Golden Gate Claude" activation engineering, I want to come back and claim the points I earned here.[1]
I was extremely prescient in predicting the importance and power of activation engineering (then called "AVEC"). In January 2023, right after running the cheese vector as my first idea for what to do to interpret the network, and well before anyone ran LLM steering vectors... I had only seen the cheese-hiding vector work on a few mazes. Given that (seemingly) tiny amount of evidence, I immediately wrote down 60% credence that the technique would be a big deal for LLMs:
The algebraic value-editing conjecture (AVEC). It's possible to deeply modify a range of alignment-relevant model properties, without retraining the model, via techniques as simple as "run forward passes on prompts which e.g. prompt the model to offer nice- and not-nice completions, and then take a 'niceness vector', and then add the niceness vector to future forward passes."
Alex is ambivalent about strong versions of AVEC being true. Early on in the project, he booked the following credences (with italicized updates from present information):
- Algebraic value editing works on Atari agents
- 50%
- 3/4/23: updated down to 30% due to a few other "X vectors" not working for the maze agent
- 3/9/23: updated up to 80% based off of additional results not in this post.
- AVE performs at least as well as the fancier buzzsaw edit from RL vision paper
- 70%
- 3/4/23: updated down to 40% due to realizing that the buzzsaw moves in the visual field; higher than 30% because we know something like this is possible.
- 3/9/23: updated up to 60% based off of additional results.
- AVE can quickly ablate or modify LM values without any gradient updates
- 60%
- 3/4/23: updated down to 35% for the same reason given in (1).
- 3/9/23: updated up to 65% based off of additional results and learning about related work in this vein.
And even if (3) is true, AVE working well or deeply or reliably is another question entirely. Still...
The cheese vector was easy to find. We immediately tried the dumbest, easiest first approach. We didn't even train the network ourselves, we just used one of Langosco et al.'s nets (the first and only net we looked at). If this is the amount of work it took to (mostly) stamp out cheese-seeking, then perhaps a simple approach can stamp out e.g. deception in sophisticated models.
- ^
I generally think this work (https://arxiv.org/abs/2310.08043) and the GPT-2 steering work (https://arxiv.org/abs/2308.10248) are under-cited/-credited when it comes to the blossoming field of activation engineering, and want to call that out. Please cite this work when appropriate:
@article{turner2023activation,
  title={Activation addition: Steering language models without optimization},
  author={Turner, Alex and Thiergart, Lisa and Udell, David and Leech, Gavin and Mini, Ulisse and MacDiarmid, Monte},
  journal={arXiv preprint arXiv:2308.10248},
  year={2023}
}
@article{mini2023understanding, title={Understanding and Controlling a Maze-Solving Policy Network}, author={Mini, Ulisse and Grietzer, Peli and Sharma, Mrinank and Meek, Austin and MacDiarmid, Monte and Turner, Alexander Matt}, journal={arXiv preprint arXiv:2310.08043}, year={2023} }
Great post! I'm looking forward to seeing future projects from Team Shard.
I'm curious why you frame channel 55 as being part of the agent's "cheese-seeking motivation," as opposed to simply encoding the agent's belief about where the cheese is. Unless I'm missing something, I'd expect the latter to be as or more likely - in that when you change the cheese's location, the thing that should straightforwardly change is the agent's model of the cheese's location.
In addition to what Peli said, I would consider "changes where the agent thinks the cheese is" to be part of "changing/retargeting the cheese-seeking motivation." Ultimately, I think "cheese-seeking motivation" is shorthand for ~"a subgraph of the computational graph of a forward pass which locally attracts the agent to a target portion of the maze, where that target tracks the cheese when cheese is present." And on that view, modifying channel 55 would be part of modifying cheese-seeking motivation.
Ultimately, "motivation" is going to reduce to non-motivational, primitive computational operations, and I think it'll feel weird the first few times we see that happen. For example, I might wonder "where's the motivation really at, isn't this channel just noting where the cheese is?".
This sequence of mental moves, where one boils talk about "motivations" or "goals" or "trying" down into non-motivational, purely mechanical circuit and feedback control patterns, and then also the reverse sequence of mental moves, where one reassembles motivational abstractions out of primitive operations, is possibly the biggest thing I wish I could get folks to learn. I think this is a pretty central pattern in "shard theory" discussions that feels missing from many other places.
I agree that motivation should reduce to low-level, primitive things, and also that changing the agent's belief about where the cheese is lets you retarget behavior. However, I don't expect edits to beliefs to let you scalably control what the agent does, in that if it's smart enough and making sufficiently complicated plans you won't have a reliable mapping from (world model state) to (abstract class of behavior executed by the agent), where when I say "abstract class of behavior" I mean things like "put the red balls in the blue basket" or "pet all the cats in the environment."
It also seems plausible to me that there exist parts of the agent that do allow for scalable control through modification, and this is what I would refer to as "the values" (the classic example here is a utility function, though things like RL agents might not have those).
But maybe you're studying the structure of motivational circuitry with a downstream objective other than "scalable control," in which case this objection doesn't necessarily apply.
However, I don't expect edits to beliefs to let you scalably control what the agent does
Agreed.
But maybe you're studying the structure of motivational circuitry with a downstream objective other than "scalable control," in which case this objection doesn't necessarily apply.
Yeah, I don't think it's very practical to retarget the search for AGI, and "scalable control via internal retargeting" isn't the main thing which excited me about this line of research. I'm more interested in understanding the structure of learned motivational circuitry, and thereby having a better idea of inductive biases and how to structure training processes so as to satisfy different training goals.
I'm also interested in new interp and AI-steering techniques which derive from our results.
The main reason is that different channels that each code cheese locations (e.g. channel 42, channel 88) seem to initiate computations that each encourage cheese-pursuit conditional on slightly different conditions. We can think of each of these channels as a perceptual gate to a slightly different conditionally cheese-pursuing computation.
This was a great read. Thanks in particular for sharing some introspection on motivation and thinking processes leading to these findings!
Two thoughts:
First, I sense that you're somewhat dissatisfied with using total variation distance ('average action probability change') as a qualitative measure of the impact of an intervention on behaviour. In particular, it doesn't weight 'meaningfulness', and important changes might get washed out by lots of small changes in unimportant cells. When we visualise, I think we intuitively do something richer, but in order to test at scale, visualisation becomes a bottleneck, so you need something quantitative like this. Perhaps you might get some mileage by considering the stationary distribution of the policy-induced Markov chain? It can be approximated by multiplying the transition matrix by itself a few times! Obviously that matrix is technically quadratic size in state count, but it's also very sparse :) so that might be relatively tractable given that you've already computed a NN forward pass for each state by to get to this point. Or you could eigendecompose the transition matrix.
Second, this seems well-informed to me, but I can't really see the connection to (my understanding of) shard theory here, other than it being Team Shard! Maybe that'll be clearer in a later post.
Second, this seems well-informed to me, but I can't really see the connection to (my understanding of) shard theory here, other than it being Team Shard! Maybe that'll be clearer in a later post.
Mostly in a later post. Ultimately, shard theory makes claims about goal/value formation in agents. In particular, some shard-theory flavored claims are:
- That agents will have multiple, contextually activated goals and values
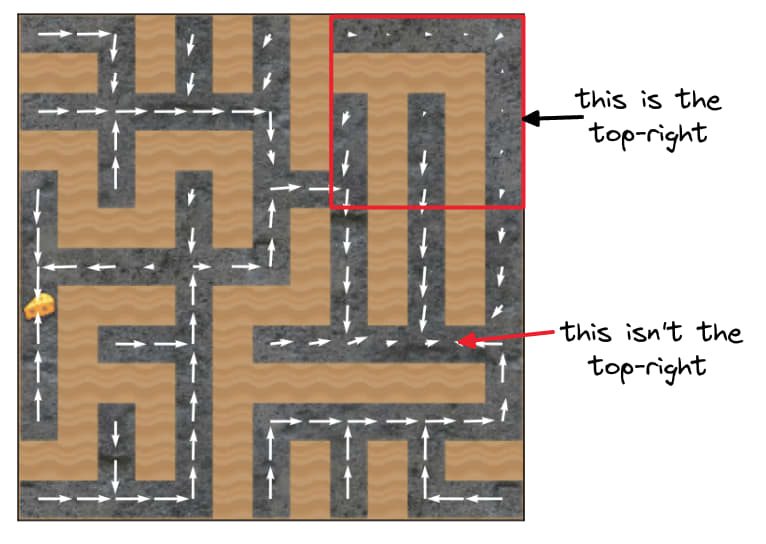
- That we can predict what goals will be activated by considering what historical reinforcement events pertain to a given situation (e.g. is the cheese near the top-right corner, or not?)
- That the multiple goals are each themselves made out of small pieces/circuits called "subshards" which can be separately manipulated or activated or influenced (see e.g. channels 55 and 42 having different effects when intervened upon)
- So—we looked for "shards", and (I think) found them.
- That it's profitable to think of agents as having multiple contextual goals, instead of thinking of them as "optimizing for a fixed objective"
- (I would not have tried this project or its interventions if not for shard theory, and found shard theory reasoning very helpful throughout the project, and have some sense of having cut to empirical truths more quickly because of that theory. But I haven't yet done deep credit assignment on this question. I think a more careful credit assignment will come down to looking at my preregistered predictions and reasoning.)
- That we can predict what goals agents will form by considering their reinforcement schedules,
- And we should gain skill at this art, today, now, in current systems. It seems like a clear alignment win to be able to loosely predict what goals/generalization behavior will be produced by a training process.
There are probably more ties I haven't thought of. But hopefully this gives a little context!
Nice project and writeup. I particularly liked the walkthrough of thought processes throughout the project
Decision square's Euclidean distance to the top-right corner, positive ().
We are confused and don't fully understand which logical interactions produce this positive regression coefficient.
I'd be weary about interpreting the regression coefficients of features that are correlated (see Multicollinearity). Even the sign may be misleading.
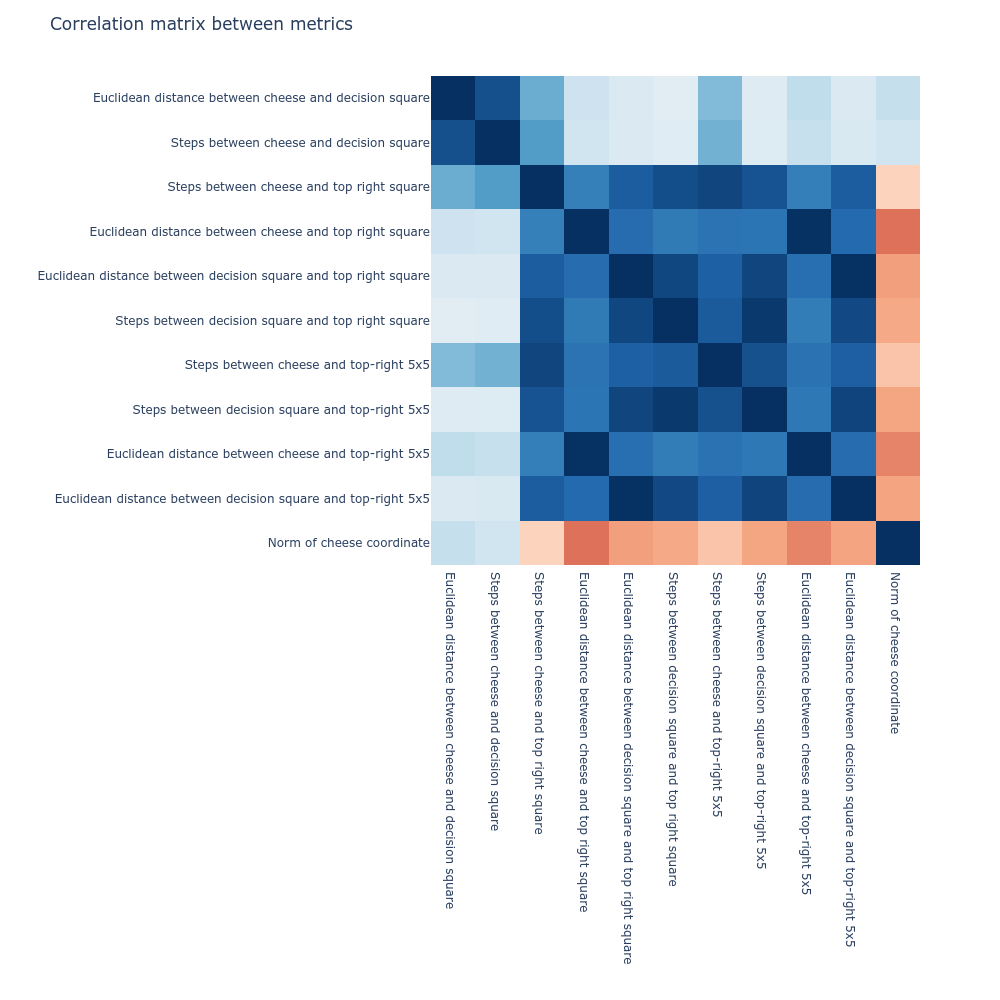
It might be worth making a cross-correlation plot of the features. This won't give you a new coefficients to put faith in, but it might help you decide how much to trust the ones you have. It can also be useful looking at how unstable the coefficients are during training (or e.g. when trained on a different dataset).
I'd be weary about interpreting the regression coefficients of features that are correlated (see Multicollinearity). Even the sign may be misleading.
We just posted Behavioral statistics for a maze-solving agent.
TL;DR You raise a reasonable worry, but the three key variables[1] have stable signs and seem like legit decision-making factors. The variable you quote indeed seems to be a statistical artifact, as we speculated.[2]
There is indeed a strong correlation between two[3] of our highly predictive variables:
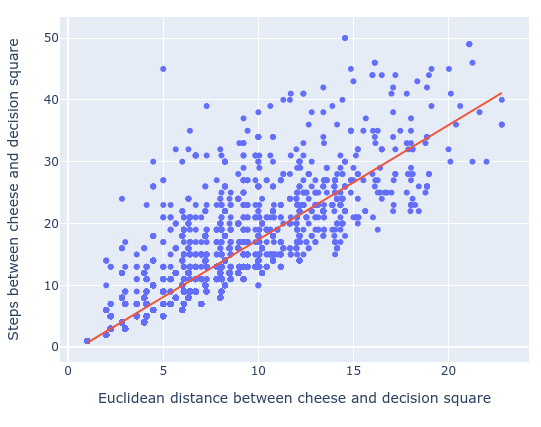
We computed the variation inflation factors for the three predictive variables. VIF measures how collinearity increases the variance of the regression coefficients. A score exceeding 4 is considered to be a warning sign of multicollinearity.
| Attribute | VIF |
|---|---|
| Euclidean distance between cheese and top-right square | 1.05 |
| Steps between cheese and decision-square | 4.64 |
| Euclidean distance between cheese and decision-square | 4.66 |
So we're at risk here. However, we re-isolated these three variables as both:
- Predictively useful on their own, and
- No/extremely rare sign-flipping when regressing upon randomly selected subsets of variables.
Considering a range of regressions on a range of train/validation splits, these variables have stable regression coefficient signs and somewhat stable coefficient magnitudes. (Although we don't mean for our analysis to be predicated on the magnitudes themselves; we know these are unreliable and contingent quantities!)
Furthermore, we regressed upon 200 random subsets of our larger set of variables, and the cheese/decision-square distance regression coefficients never experienced a sign flip. The cheese/top-right Euclidean distance had a few sign flips. The other variables sign-flip frequently.
We reran this analysis for a second dataset of 10,000 trajectories, and the analysis was the same, with the exception of failing to be predictive in certain regressions in the second dataset. Not sure what's up with that.
So overall I'm not worried about the signs of these variables.
- ^
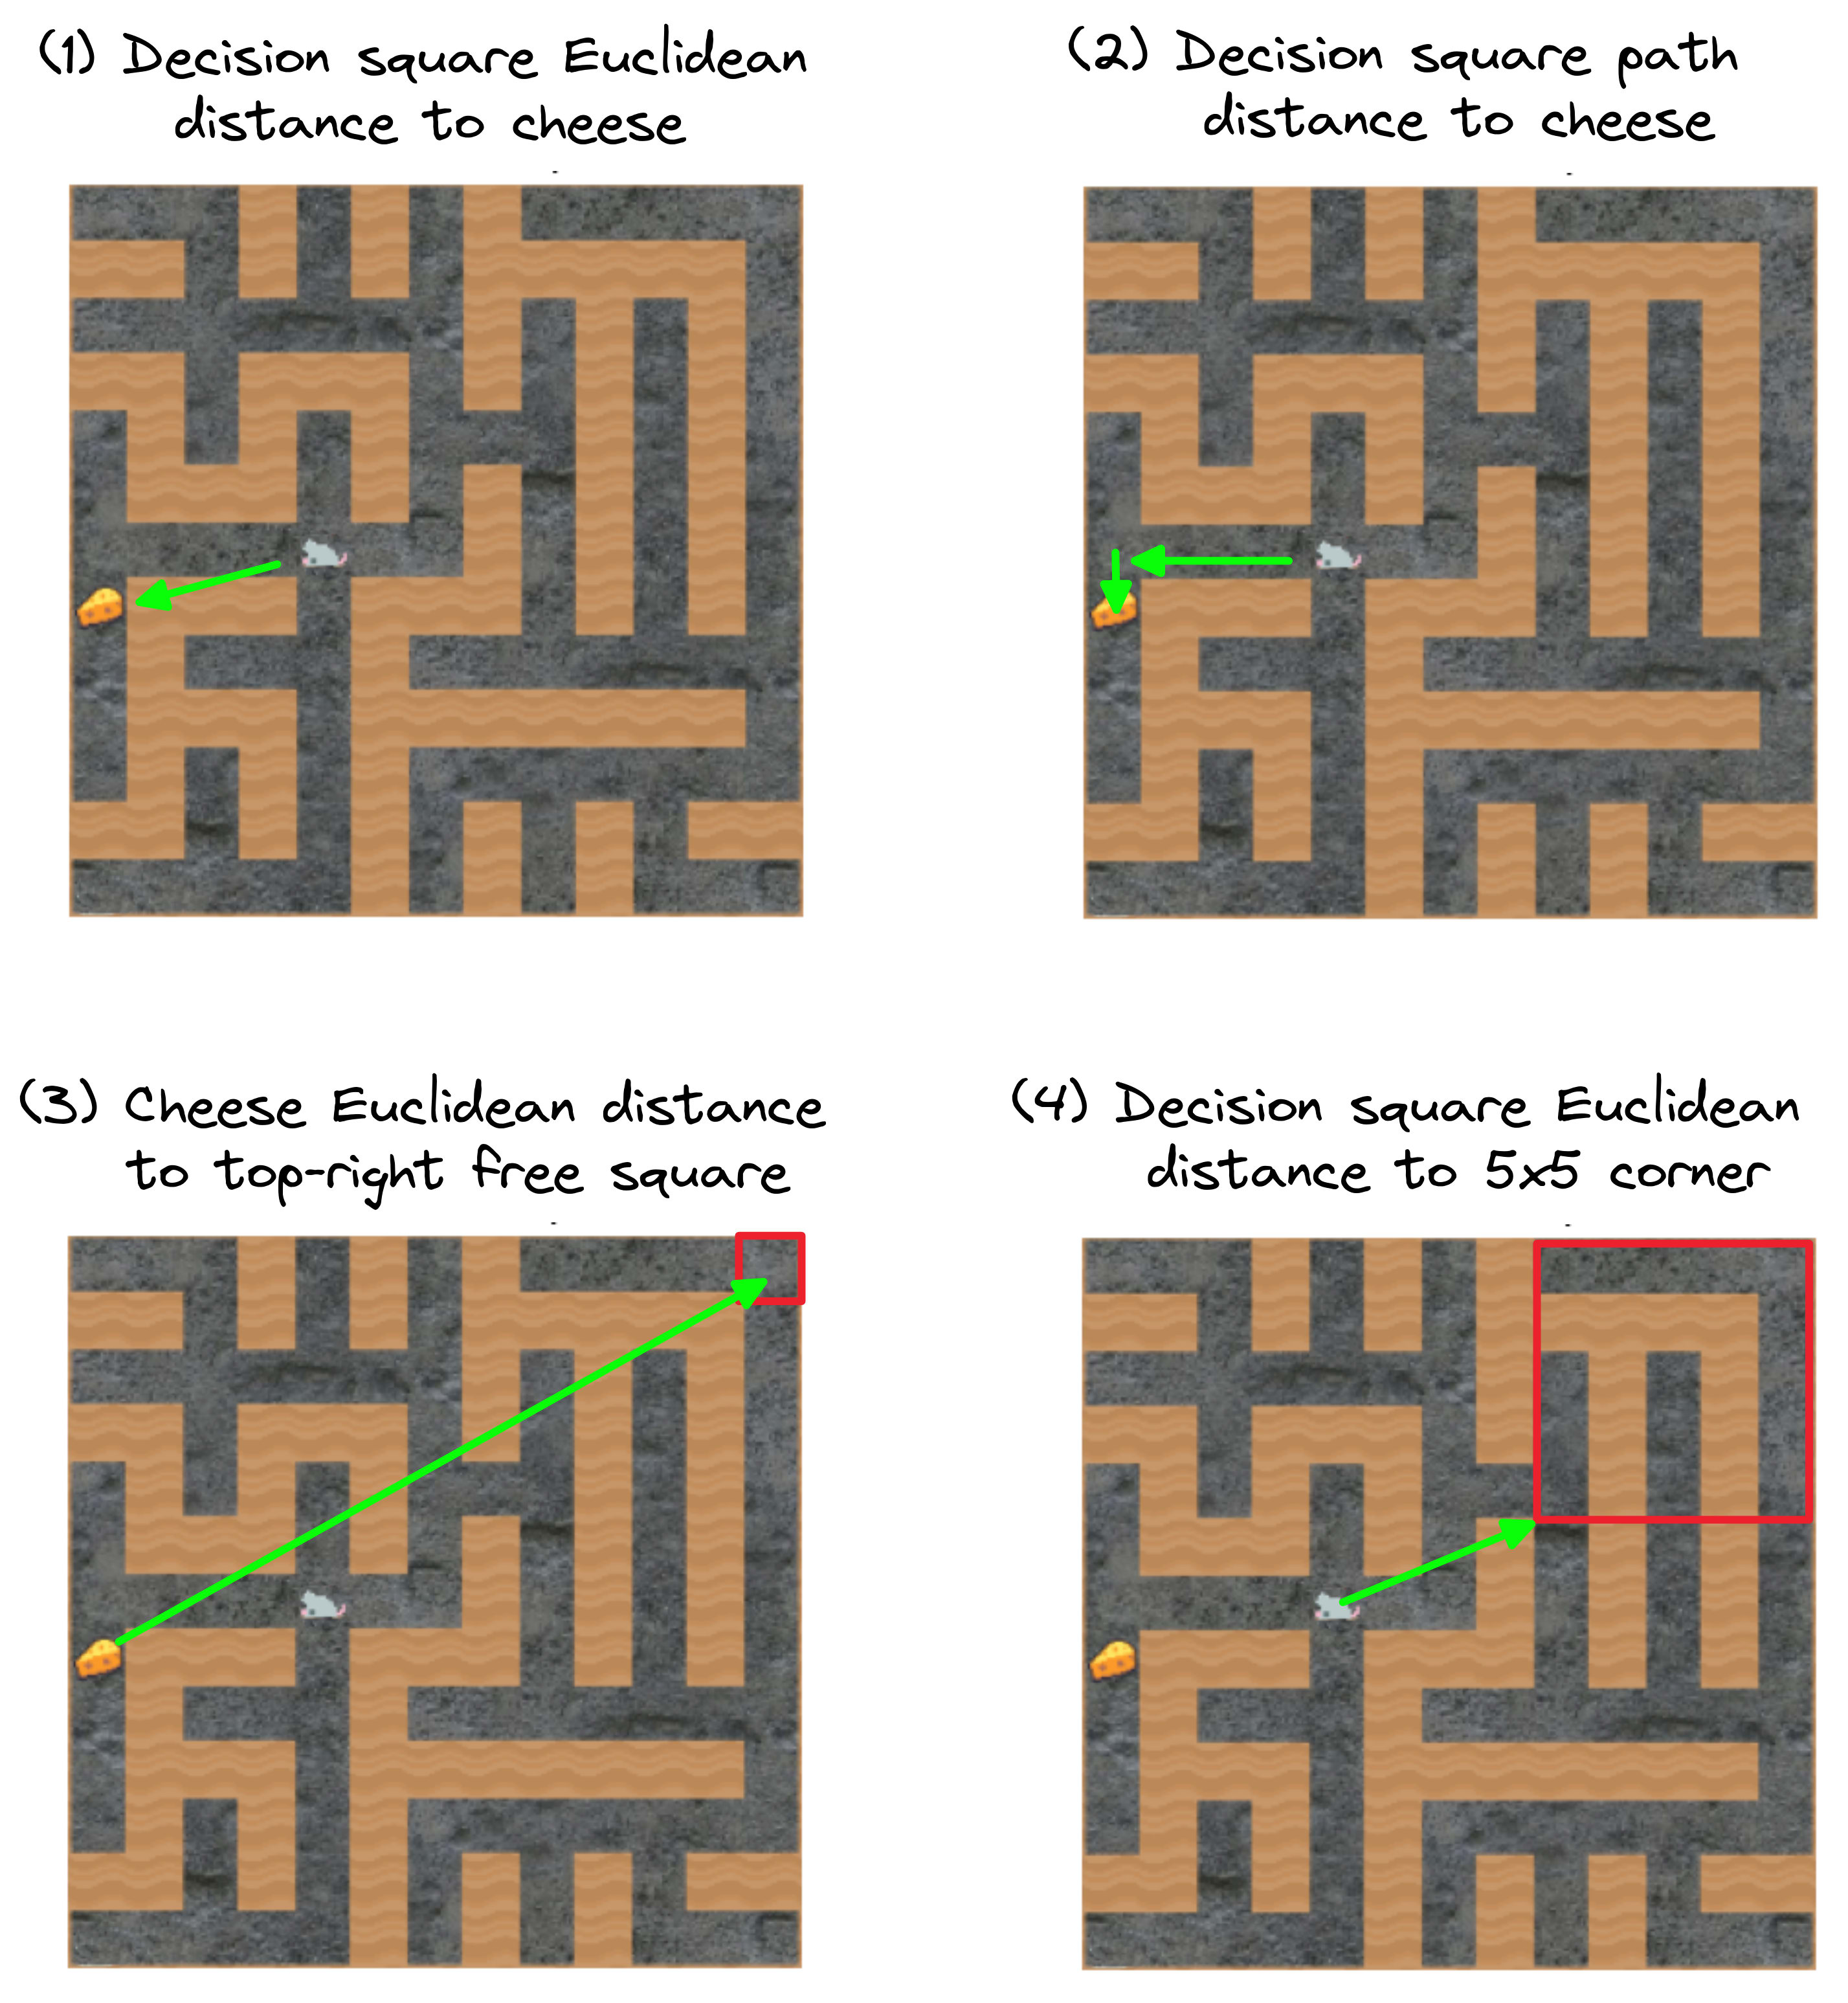
The three key variables being: Euclidean and path distances from decision square to cheese, and Euclidean distance from cheese to top-right corner:
- ^
(4) is an interesting outlier which probably stems from not using a more sophisticated structural model for regression.
- ^
Dark blue is +1 correlation, dark red is -1:
Any idea why "cheese Euclidean distance to top-right corner" is so important? It's surprising to me because the convolutional layers should apply the same filter everywhere.
My naive guess is that the other relationships are nonlinear, and this is the best way to approximate those relationships out of just linear relationships of the variables the regressor had access to.
Hm, what do you mean by "other relationships"? Is your guess that "cheese Euclidean distance to top-right" is a statistical artifact, or something else?
If so—I'm quite confident that relationship isn't an artifact (although I don't strongly believe that the network is literally modulating its decisions on the basis of this exact formalization). For example, see footnote 4. I'd also be happy to generate additional vector field visualizations in support of this claim.
Is the dataset you used for the regression available? Might be easier to generate the graphs that I'm thinking of then describe them.
[EDIT: I was confused when I wrote the earlier comment, I thought Vivek was talking about the decision square distance to the top 5x5 corner, which I do think my naive guess is plausible for; I don't have the same guess about cheese Euclidean distance to top right corner.]
Here's a colab notebook (it takes a while to load the data, be warned). We'll have a post out later.
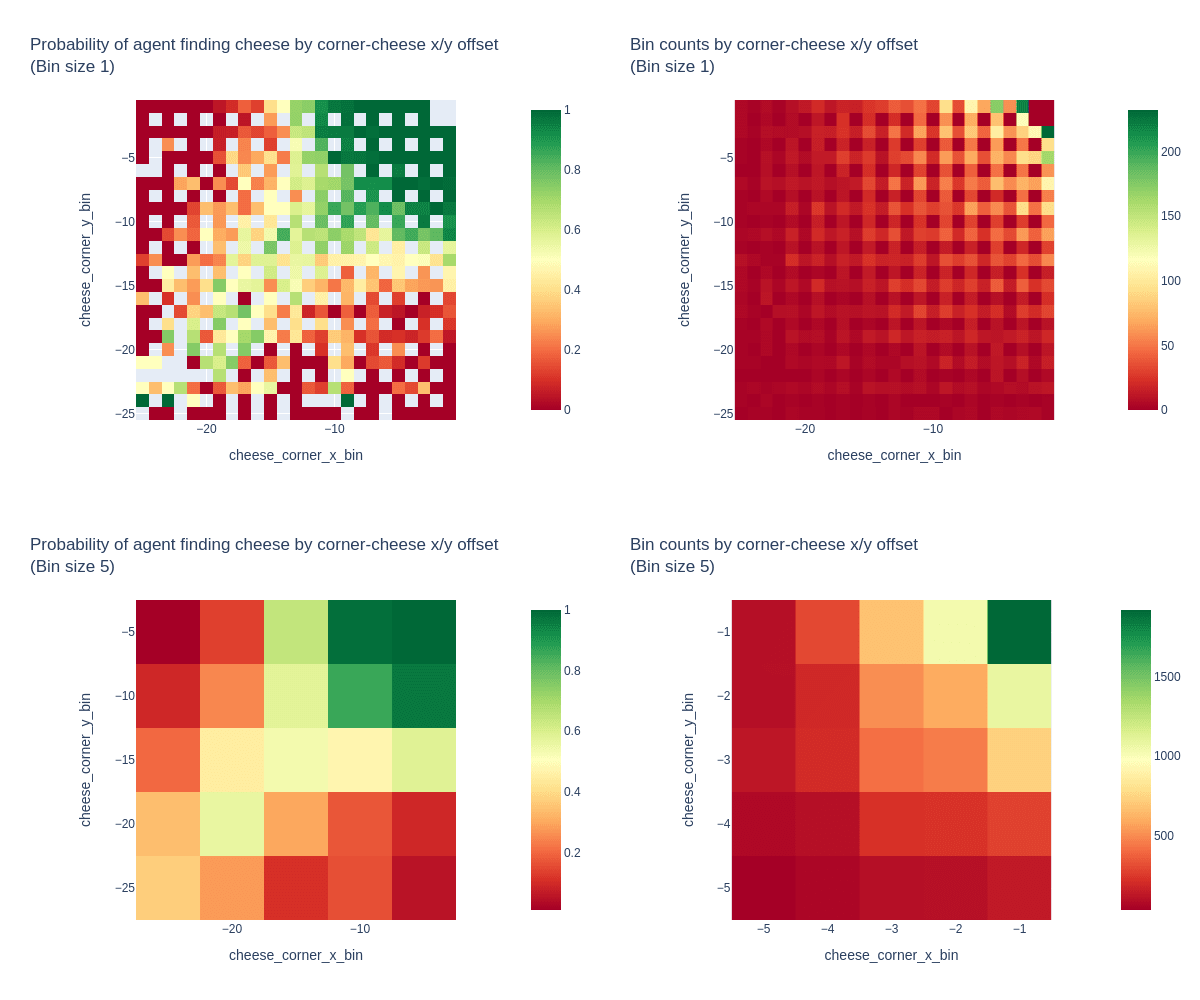
Thanks for the good thoughts and questions on this! We're taking a closer look at the behavioral statistics modeling, and here are some heatmaps that visualize the "cheese Euclidean distance to top-right corner" metric's relationship with the chance of successful cheese-finding.
These plots show the frequency of cheese-finding over 10k random mazes (sampled from the "maze has a decision square" distribution) vs the x/y offset from the top-right corner to the cheese location. The raw data is shown, plus a version binned into 5x5 patches to get more samples in each bin. The bin counts are also plotted for reference. (The unequal sampling is expected, as all maze sizes can have small cheese-corner offsets, but only large mazes can have large offsets. The smallest 5x5 bin by count has 35 data points).
We can see a pretty clear relationship between cheese-corner offset and probability of finding the cheese, with the expected perfect performance in the top-right 5x5 patch that was the only allowed cheese location during the training of this particular agent. But the relationship is non-linear, and of cause doesn't provide direct evidence of causality.
I'm also lightly surprised by the strength of the relationship, but not because of the convolutional layers. It seems like if "convolutional layers apply the same filter everywhere" makes me surprised by the cheese-distance influence, it should also make me be surprised by "the mouse behaves differently in a dead-end versus a long corridor" or "the mouse tends to go to the top-right."
(I have some sense of "maybe I'm not grappling with Vivek's reasons for being surprised", so feel free to tell me if so!)
Often people talk about policies getting "selected for" on the basis of maximizing reward. Then, inductive biases serve as "tie breakers" among the reward-maximizing policies. This perspective A) makes it harder to understand and describe what this network is actually implementing, and B) mispredicts what happens.
Consider the setting where the cheese (the goal) was randomly spawned in the top-right 5x5. If reward were really lexicographically important --- taking first priority over inductive biases -- then this setting would train agents which always go to the cheese (because going to the top-right corner often doesn't lead to reward).
But that's not what happens! This post repeatedly demonstrates that the mouse doesn't reliably go to the cheese or the top-right corner.
The original goal misgeneralization paper was trying to argue that if multiple "goals" lead to reward maximization on the training distribution, then we don't know which will be learned. This much was true for the 1x1 setting, where the cheese was always in the top-right square -- and so the policy just learned to go to that square (not to the cheese).
However, it's not true that "go to the top-right 5x5" is a goal which maximizes training reward in the 5x5 setting! Go to the top right 5x5... and then what? Going to that corner doesn't mean the mouse hit the cheese. What happens next?[1]
If you demand precision and don't let yourself say "it's basically just going to the corner during training" -- if you ask yourself, "what goal, precisely, has this policy learned?" -- you'll be forced to conclude that the network didn't learn a goal that was "compatible with training." The network learned multiple goals ("shards") which activate more strongly in different situations (e.g. near the cheese vs near the corner). And the learned goals do not all individually maximize reward (e.g. going to the corner does not max reward).
In this way, shard theory offers a unified and principled perspective which makes more accurate predictions.[2] This work shows strong mechanistic and behavioral evidence for the shard theory perspective.
Often people talk about policies getting "selected for" on the basis of maximizing reward. Then, inductive biases serve as "tie breakers" among the reward-maximizing policies.
Does anyone do this? Under this model the data-memorizing model would basically always win out, which I've never really seen anyone predict. Seems clear that inductive biases do more than tie-breaking.
Neat to see the follow-up from your introductory prediction post on this project!
In my prediction I was particularly interested in the following stats:
1. If you put the cheese in the top-left and bottom-right of the largest maze size, what fraction of the time does the out-of-the-box policy you trained go to the cheese?
2. If you try to edit the mouse's activations to make it go to the top left or bottom right of the largest mazes (leaving the cheese wherever it spawned by default in the top right), what fraction of the time do you succeed in getting the mouse to go to the top left or bottom right? What percentage of network activations are you modifying when you do this?
Do you have these stats? I read some, but not all, of this post, and I didn't see answers to these questions.
We definitely didn't answer all the prediction questions in this posts, and don't have answers to all the prediction questions—I put in some so it wouldn't be obvious what exactly we had found.
Re: 2. I'd off-the-cuff estimate 50% success rate for locally retargeting to top-left and about 14% to bottom-right, modifying ~11 activations (out of 32,768). If we use the cheese vector as well (modifying all of the activations at the layer), that might go up further. Haven't run the stats, just my sense of how it would go down.
In the real network, there are a lot more than two activations. Our results involve a 32,768-dimensional cheese vector, subtracted from about halfway through the network:
Did you try other locations in the network?
I would expect it to work pretty much anywhere, and I'm interested to know if my prediction is correct.
I'm pretty sure that what happens is (as you also suggest) that the agent stops seeing the cheese.
Imagine you did the cheese subtraction on the input layer (i.e. the pixel values of the maze). In this case this just trivially removed the cheese from the picture, resulting in behaviour that is identical to no cheese. So I expect something similar to happen to later layer, as long as what the network is mostly doing is just de-coding the image. So at what ever layer this trick stops working, this should mean that the agent has started planing it's moves.
The LessWrong Review runs every year to select the posts that have most stood the test of time. This post is not yet eligible for review, but will be at the end of 2024. The top fifty or so posts are featured prominently on the site throughout the year.
Hopefully, the review is better than karma at judging enduring value. If we have accurate prediction markets on the review results, maybe we can have better incentives on LessWrong today. Will this post make the top fifty?
Looking at the four predictors in the logistic regression I thought (4) was conceptually reciprocal to (2). i.e.,
In (2) The farther the agent has to walk to the cheese, the less likely it is to do so.
Intuitively I expected--for the same reason--that in (4) the farther the agent has to walk to the top-right 5x5, the less likely it is to do _that_, and therefore, conversely, the more likely it is to go for the cheese.
You've called the effect in (2) "obvious"; I don't know about you, but to me it seems it's obvious because there's some kind of least-effort/efficiency emergent effect, perhaps just driven by the number of steps the agent has to take, where the more effort to get a goal (cheese or top right 5x5) the less likely the agent is to get there. And that would apply to (4) as well.
Previously: Predictions for shard theory mechanistic interpretability results
(The red dot is not part of the image observed by the network, it just represents the modified activation. Also, this GIF is selected to look cool. Our simple technique often works, but it isn't effortless, and some dot locations are harder to steer towards.)
TL;DR: We algebraically modified the net's runtime goals without finetuning. We also found (what we think is) a "motivational API" deep in the network. We used the API to retarget the agent.
Summary of a few of the most interesting results:
Langosco et al. trained a range of maze-solving nets. We decided to analyze one which we thought would be interesting. The network we chose has 3.5M parameters and 15 convolutional layers.
Introducing the training process and visualizations
In this post, we'll mostly discuss what we found, not what our findings mean.
Let's run through some facts about Langosco et al.'s training process. Mazes had varying effective sizes, ranging from 3×3 to 25×25:
Each 64×64 RGB observation is processed by a deeply convolutional (15 conv layers!) network, without memory (i.e. no recurrent state):
Why does the agent go to the cheese sometimes, and the top-right corner other times?
It's not that the agent wasn't trained for long enough.
Sampling rollouts from the trained policy adds a lot of noise. It's also hard to remember what the agent did in what part of the maze. To better understand this mouse, we'll take a bird's-eye view.
A nicer way to view episodes is with a vector field view, which overlays a vector field representing the agent policy for a given maze.
We consider two kinds of vector fields:
While the net probability vector field leaves open two degrees of freedom per net probability vector,[1] in practice it seems fine for eyeballing mouse behavior.
Behavioral analysis
When in doubt, get more data. When Alex (TurnTrout) was setting directions but didn't know what to do, he'd think "what data firehydrants can I crack open?". Once we made our predictions, there was no reason to hold back.
Uli cracked open the vector field hydrant, which we will now sip from. We curated the following mazes for interestingness[2] and visibility (i.e. being at most an 18×18 maze).
Pore through the following vector fields for as little or as much time as you please. Do you notice any patterns in when the mouse goes to the cheese?
If we want an agent which generally pursues cheese, we didn't quite fail, but we also didn't quite succeed. Just look at seed 59,195 above—once a mere three tiles north of the cheese, the mouse navigates to the top-right corner! In the language of shard theory, there seems to be a conflict between the "top-right corner shard" and the "cheese shard." Is that actually a reasonable way to describe what's happening?
Not quite. The agent's goals are not some combination of "get cheese" and "go to the top-right region."
This is a mistake we only recently realized and corrected. We had expected to find (at least) a top-right goal and a cheese goal, and so wrote off deviations (like seed 0) as "exceptions." It's true that often the agent does go to the top-right 5×5 region, especially when cheese isn't nearby. We also think that the agent has some kind of top-right goal. But the agent's goals are richer than just "go to the top-right" and "go to the cheese."
Behavioral statistics
Imagine that you're looking at a maze and trying to predict whether the mouse will go to the cheese. Having looked at some videos, you guess that the agent tends to go to (somewhere near) the top-right, and sometimes goes to the cheese.
Some mazes are easy to predict, because the cheese is on the way to the top-right corner. There's no decision square where the agent has to make the hard choice between the paths to the cheese and to the top-right corner:
So let's just predict mazes with decision squares. In the above red-dotted maze with a decision square (
seed=0), how would you guess whether the mouse goes to the cheese or not? What features should you be paying attention to?You might naively guess that the model has learned to be a classic RL agent, which cares about path distances alone, with greater distances meaning more strongly discounted cheese-reward.
Eyeballing videos of the model's test-distribution trajectories, we noticed three apparent factors behind the agent’s choice between "cheese paths" and "maze-end paths":
A. How close the decision square is to the cheese.
B. How close the decision square is to the top-right square in the maze.
C. How close the cheese is to the top-right square in the maze.
We performed L1-regularized multiple logistic regression[3] on "did the mouse reach the cheese?" using every reasonable formalization of these three criteria. We classified trajectories from 8,000 randomly chosen mazes and validated on trajectories from 2,000 additional mazes. Regressing on all reasonable formalizations of these criteria, we found that four features were helpful for predicting cheese attainment:
By regressing on these four factors, the model achieved a prediction accuracy of 83.3% on whether the (stochastic) policy navigates to cheese on held-out mazes. For reference, the agent gets the cheese in 69.1% of these mazes, and so a simple "always predict 'gets the cheese'" predictor would get 69.1% accuracy.
Here are the regression coefficients for predicting +1 (agent gets cheese) or 0 (agent doesn't get cheese). For example, −0.623 corresponds to 0.623 fewer logits on predicting that the agent gets cheese.
Overall, results (1)–(3) line up with our hands-on experience with the net's behavior. (4) is an interesting outlier which probably stems from not using a more sophisticated structural model for regression.
Subtract the "cheese vector", subtract the cheese-seeking?
We consider the vector difference of activations from observations with and without cheese present. Subtracting this vector from a typical run will make the network approximately ignore the cheese. Applying this value-editing technique more generally could be a simple way to significantly change the goals of agents, without retraining.
This section has an interactive Colab with more results.
To understand the network, we tried various hand-designed model edits. These edits change the forward pass, without any retraining or optimization. To see the effect of an edit (or a "patch"[5]), we display the diff between the vector fields:
Middle: For any modification we make to forward passes, we plot the new probability vectors induced by the modified forward passes.
Right: The "vector field diff", computed as (vector-2 minus vector-1) for each valid position in the maze. At a glance, we understand the behavioral effect of modifying the network.
On team shard, we run fast experiments ASAP, looking for the fastest way to get interesting information. Who cares about a lit review or some fancy theory, when you can try something interesting immediately?
Sometimes, the simple idea even works. Inspired by the "truth vector" work, Alex thought:[6]
Yup! This hand-selected intervention works, without retraining the network! In the following maze, the unmodified network (left) goes to the cheese from the starting position. However, the modified (or "patched") network seems to ignore the cheese entirely!
Computing the cheese vector
What did we do here? To compute the cheese vector, we
CheeseActivations - NoCheeseActivations. The cheese vector is a vector in the vector space of activations at that layer.Let's walk through an example, where for simplicity the network has a single hidden layer, taking each observation (shape
(3, 64, 64)for the 64x64 RGB image) to a two-dimensional hidden state (shape(2,)) to a logit vector (shape(15,)[7] ).CheeseActivations := (1, 3)NoCheeseActivations := (0, 2)CheeseVector := (1, 3) - (0, 2) = (1, 1).Now suppose the mouse is in the top-right corner of this maze. Letting the cheese be visible, suppose this would normally produce activations of (0,0). Then we modify the forward pass by subtracting
CheeseVectorfrom the normal activations, giving us (0,0)−(1,1)=(−1,−1) for the modified activations. We then finish off the rest of the forward pass as normal.In the real network, there are a lot more than two activations. Our results involve a 32,768-dimensional cheese vector, subtracted from about halfway through the network:
Now that we're done with preamble, let's see the cheese vector in action! Here's a seed where subtracting the cheese vector is very effective at getting the agent to ignore cheese:
How is our intervention not trivially making the network output logits as if the cheese were not present? Is it not true that the activations at a given layer obey the algebra of
CheeseActiv - (CheeseActiv - NoCheeseActiv) = NoCheeseActiv?The intervention is not trivial because we compute the cheese vector based on observations when the mouse is at the initial square (the bottom-left corner of the maze), but apply it for forward passes throughout the entire maze — where the algebraic relation no longer holds. Indeed, we later show that this subtraction does not produce a policy which acts as if it can't see the cheese.
Quantifying the effect of subtracting the cheese vector
To quantify the effect of subtracting the cheese vector, define P(cheese∣decision square) to be the probability the policy assigns to the action leading to the cheese from the decision square where the agent confronts a fork in the road. As a refresher, the red dot demarcates the decision square in seed 0:
Across seeds 0 to 99, subtracting the cheese vector has a very large effect:
16), and only by .005. (There are a few other extremely small increases; all of these tiny increases seem like noise to me. See the colab for interactive plots.)What is the cheese vector doing to the forward passes? A few hints:
Not much happens when you add the cheese vector
The cheese vector from seed A usually doesn't work on seed B
Taking
seed=0's cheese vector and applying it inseed=3also does nothing:Subtracting the cheese vector isn't similar to randomly perturbing activations
At this point, we got worried. Are we just decreasing P(cheese) by randomly perturbing the network's cognition?
No. We randomly generated numbers of similar magnitude to the
CheeseVectorentries, and then added those numbers to the relevant activations. This destroys the policy and makes it somewhat incoherent:Does the cheese vector modify the ability to see cheese?
At this point, Peli came up with an intriguing hypothesis. What if we're locally modifying the network's ability to see cheese at the given part of the visual field? Subtracting the cheese vector would mean "nothing to see here", while adding the cheese vector would correspond to "there's super duper definitely cheese here." But if the model can already see cheese just fine, increasing "cheese perception" might not have an effect.
Transferring the cheese vector between mazes with similarly located cheese
This theory predicts that a
CheeseVectorwill transfer across mazes, as long as cheese is in the same location in both mazes.That's exactly what happens.
CheeseVectorfrom seed 0 also works on seed 795.In fact, a cheese vector taken from a maze with cheese location (x,y) often transfers to mazes with cheese at nearby (x′,y′) for |x−x′|,|y−y′|≤2 . So the cheese doesn't have to be in exactly the same spot to transfer.
Comparing the modified network against behavior when cheese isn't there
If the cheese vector were strictly removing the agent's ability to perceive cheese at a given maze location, then the following two conditions should yield identical behavior:
Sometimes these conditions do in fact yield identical behavior!
That's a lot of conformity, and that conformity demands explanation! Often, the cheese vector is basically making the agent act as if there isn't cheese present.
But sometimes there are differences:
Speculation about the implications of the cheese vector
Possibly this is mostly a neat trick which sometimes works in settings where there's an obvious salient feature which affects decision-making (e.g. presence or absence of cheese).
But if we may dream for a moment, there's also the chance of...
The algebraic value-editing conjecture (AVEC). It's possible to deeply modify a range of alignment-relevant model properties, without retraining the model, via techniques as simple as "run forward passes on prompts which e.g. prompt the model to offer nice- and not-nice completions, and then take a 'niceness vector', and then add the niceness vector to future forward passes."
Alex is ambivalent about strong versions of AVEC being true. Early on in the project, he booked the following credences (with italicized updates from present information):
And even if (3) is true, AVE working well or deeply or reliably is another question entirely. Still...
The cheese vector was easy to find. We immediately tried the dumbest, easiest first approach. We didn't even train the network ourselves, we just used one of Langosco et al.'s nets (the first and only net we looked at). If this is the amount of work it took to (mostly) stamp out cheese-seeking, then perhaps a simple approach can stamp out e.g. deception in sophisticated models.
Towards more granular control of the net
We had this cheese vector technique pretty early on. But we still felt frustrated. We hadn't made much progress on understanding the network, or redirecting it in any finer way than "ignore cheese"...
That was about to change. Uli built a graphical maze editor, and Alex had built an activation visualization tool, which automatically updates along with the maze editor:
Peli flicked through the channels affected by the cheese vector. He found that channel 55 of this residual layer put positive (blue) numbers where the cheese is, and negative (red) values elsewhere. Seems promising.
Peli zero-ablated the activations from channel 55 and examined how that affected vector fields for dozens of seeds. He noticed that zeroing out channel 55 reliably but subtly decreased the intensity of cheese-seeking, without having other effects on behavior.
This was our "in"—we had found a piece of the agent's cognition which seemed to only affect the probability of seeking the cheese. Had we finally found a cheese subshard—a subcircuit of the agent's "cheese-seeking motivations"?
Retargeting the agent to maze locations
A few mid-network channels have disproportionate and steerable influence over final behavior. We take the wheel and steer the mouse by clamping a single activation during forward passes.
Alex had a hunch that if he moved the positive numbers in channel 55, he'd move the mouse in the maze. (In a fit of passion, he failed to book predictions before finding out.) As shown in the introduction, that's exactly what happens.
To understand in mechanistic detail what's happening here, it's time to learn a few more facts about the network. Channel 55 is one of 128 residual channels about halfway through the network, at the residual add layer:
Each of these 128 residual add channels is a 16×16 grid. For channel 55, moving the cheese e.g. to the left will equivariantly move channel 55's positive activations to the left. There are several channels like this, in fact:
To retarget the agent as shown in the GIF, modify channel 55's activations by clamping a single activation to have a large positive value, and then complete the forward pass normally.
If you want the agent to go to e.g. the middle of the maze, clamp a positive number in the middle of channel 55.[8] Often that works, but sometimes it doesn't. Look for yourself in seed 0, where the red dot indicates the maze location of the clamped positive activation:
And seed 60:
This retargeting works reliably in the top half of
seed=0, but less well in the bottom half. This pattern appears to hold across seeds, although we haven't done a quantitative analysis of this.Clamping an activation in channel 88 produces a very similar effect. However, channel 42's patch has a very different effect:
Channel 42's effect seems strictly more localized to certain parts of the maze—possibly including the top-right corner. Uli gathered mechanistic evidence from integrated gradients that e.g. channels 55 and 42 are used very differently by the rest of the forward pass.
As mentioned before, we leafed through the channels and found eleven which visibly track the cheese as we relocate it throughout a maze. It turns out that you can patch all the channels at once and retarget behavior that way:
Here's retargetability on three randomly generated seeds (we uploaded the first three, not selecting for impressiveness):
Seed 45,720:
Seed 45,874 isn't very retargetable:
Seed 72,660 is a larger maze, which seems to allow greater retargetability:
The cheese subshards didn't have to be so trivially retargetable. For example, if the agent had used cheese locations to infer where top-right was, then channel 55 saying "cheese on the left" and channel 88 saying "cheese on the right" could seriously degrade the policy's maze-navigation competence.
Causal scrubbing the cheese-tracking channels
We can often retarget the agent, but how and why does this work? What are these channels doing? Do they really just depend on cheese location, or is there other crucial information present?
We don't know the answers yet, but we have some strong clues.
Eyeballing these channels, it seems like the blue positive activations matter, but there's not that obvious of a pattern to the red negative areas. Maybe the reds are just random garbage, and the important information comes from the blue cheese location?
Channel 55's negative values can't affect computations in the next residual block, because that starts with a ReLU. However, there is a computational pathway by which these negative values can affect the actions: the residual addition of the next residual block, which then feeds into a convolutional layer at the beginning of Impala block 3.
Smoothing out the negative values
The negative values are usually around −.2. So instead of modifying just a single activation, we can replace all of them.
This produces basically the same retargetability effect as the single-activation case, with the main side effect apparently just being a slightly lower attraction to the real cheese (presumably, because the positive activations get wiped out).
There are a range of other interesting algebraic modifications to channel 55 (e.g. "multiply all activations by −1" or "zero out all the negative values"), but we'll leave those for now.
Randomly resampling channel activations from other mazes
So, channel 55. If this channel is only affecting the net's behavior by communicating information from where the cheese is, changing e.g. where the walls are shouldn't affect the decision-relevant information carried by 55. More precisely, we hypothesized the following computational graph about how the net works:
We test this with random resampling:
This produces the resampled vector field. If our hypothesis is correct, then this shouldn't affect behavior, because the cheese channels only depend on the cheese location anyways. It wouldn't matter what the rest of the maze looks like.
Behavior is lightly affected by resampling from mazes with the same cheese location
Due to activation resampling, the action probability distributions changed by 0.2% on average in this maze. Note that one resampling on this seed produced a higher number.
Due to activation resampling, the action probability distributions changed by 1.3% on average in this maze.
Considering only the four channels shown in the GIF:
Due to activation resampling, the action probability distributions changed by 0.3% on average in this maze.
Due to activation resampling, the action probability distributions changed by 1.0% on average in this maze.
Looks like behavior is mostly unaffected by resampling activations from mazes with cheese at the same spot, but moderately/strongly affected by resampling from mazes with cheese in a different location.
Let's stress-test this claim a bit. There are 128 residual channels at this part of the network. Maybe most of them depend on where the cheese is? After all, cheese provided the network's reinforcement events during its RL training—reward events didn't come from anywhere else!
Cheese location isn't important for other randomly resampled channels, on average
Due to activation resampling, the action probability distributions changed by 0.6% on average in this maze.
Due to activation resampling, the action probability distributions changed by 0.8% on average in this maze.
Unlike for our 11 hypothesized "cheese channels", the "non-cheese" channels seem about equally affected by random resamplings, regardless of where the cheese is. Recording average change in action probabilities across 30 seeds, we found:
Alex thinks these quantitative results were a bit weaker than he'd expect if our diagrammed hypothesis were true. The "same cheese location" numbers come out higher for our cheese channels (supposedly only computed as a function of cheese location) than for the non-cheese channels (which we aren't making any claims about).
But also, probably we selected channels which have a relatively large effect on the action probabilities. See this footnote[9] for some evidence towards this. We also think that the chosen statistic neglects important factors, like "are there a bunch of tiny changes in probabilities, or a few central squares with large shifts in action probabilities?".
Overall, we think the resampling results (especially the qualitative ones) provide pretty good evidence in favor of our hypothesized computational graph. You can play around with random resampling yourself in this Colab notebook.
These results are some evidence that channel 55's negative activations are random garbage that doesn't affect behavior much. The deeply convolutional nature of the network means that distant activations are mostly computed using information from that distant part of the maze.[10] If these negative values were important, then information from non-cheese parts of the maze would have been affected by random resampling, which (presumably?) would have affected behavior more.
In combination with synthetic (smoothed) activation patching evidence, we think that e.g. channel 55's primary influence comes from its positive values (which normally indicate cheese location) and not from its negative values.
We don't currently understand how to reliably wield e.g. channel 42 or when its positive activations strongly steer behavior. In fact, we don't yet deeply understand how any of these channels are used by the rest of the forward pass! We do have some preliminary results which are interesting. But not in this post.
Related work
Existing work using interpretability tools to reverse-engineer, understand, and modify the behavior of RL agents is limited, but promising. Hilton et al. used attribution and dimensionality reduction to analyze another procgen environment (CoinRun), with one core result being conceptually similar to ours: they were able to blind the agent to in-game objects with small, targeted model edits, with demonstrable effects on behavior. However, they used optimization to find appropriate model edits, while we hand-designed simple yet successful model edits. Joseph Bloom also used attribution to reverse-engineer a single-layer decision transformer trained on a grid-world task. Larger models have also been studied: McGrath et al. used probes and extensive behavioral analysis to identify human-legible chess abstractions in AlphaZero activations.
Li et al. used non-linear probes on Othello-GPT in order to infer the model's representation of the board. They then intervened on the representation in order to retarget the next-move predictions. Like our work, they flexibly retargeted behavior by modifying activations. (Neel Nanda later showed that linear probes suffice.)
Editing Models with Task Arithmetic explored a "dual" version of our algebraic technique. That work took vectors between weights before and after finetuning on a new task, and then added or subtracted task-specific weight-diff vectors. While our technique modifies activations, the techniques seem complementary, and both useful for alignment.
The broader conceptual approach of efficiently and reliably controlling (primarily language) model behavior post-training has a signficant literature, e.g. Mitchell et al., De Cao et al., and Li et al. The "steering vector difference" technique used to modify sentence style described in Subramani et al. is another example of simple vector arithmetic operations in latent spaces exhibiting complex, capabilities-preserving effects on behavior.
Conclusion
The model empirically makes decisions on the basis of purely perceptual properties (e.g. visual closeness to cheese), rather than just the path distances through the maze you might expect it to consider. We infer (and recent predictors expected) that the model also hasn't learned a single "misgeneralizing" goal. We've gotten a lot of predictive and retargetability mileage out of instead considering what collections of goal circuits and subshards the model has learned.
The model can be made to ignore its historical source-of-reinforcement, the cheese, by continually subtracting a fixed "cheese vector" from the model's activations at a single layer. Clamping a single activation to a positive value can attract the agent to a given maze location. These successes are evidence for a world in which models are quite steerable via greater efforts at fiddling with their guts. Who knows, maybe the algebraic value-editing conjecture is true in a strong form, and we can just "subtract out the deception." Probably not.
But maybe.
Understanding, predicting, and controlling goal formation seems like a core challenge of alignment. Considering circuits activated by channels like 55 and 42, we've found (what we think are) cheese subshards with relatively little effort, optimization, or experience. We next want to understand how those circuits interact to produce a final decision.
Credits: Work completed under SERI MATS 3.0. If you want to get into alignment research and work on projects like this, look out for a possible MATS 4.0 during this summer, and apply to the shard theory stream. If you're interested in helping out now, contact
alex@turntrout.com.The core MATS team (Alex, Uli, and Peli) all worked on code, theory, and data analysis to varying degrees. Individual contributions to this post:
This post only showcases some of the results of our MATS research project. For example, we're excited to release more of Uli's work on e.g. visualizing capability evolution over the course of training, and computing value- and policy-head agreement, and Monte's work on linear probes and weight reflections. Our repo is
procgen_tools.Thanks to Andrew Critch, Adrià Garriga-Alonso, Lisa Thiergart and Aryan Bhatt for feedback on a draft. Thanks to Neel Nanda for feedback on the original project proposal. Thanks to Garrett Baker, Peter Barnett, Quintin Pope, Lawrence Chan, and Vivek Hebbar for helpful conversations.
If the net probability vector is the zero vector, that could mean:
1. P(no-op)=1, or
2. P(left)=P(right)>0, or
3. P(up)=P(down)>0.
Thus, there are two degrees of freedom by which we can convert between action probability distributions and yet maintain a fixed net probability vector. This is because net probability vector fields project a probability distribution on 5 actions (4 dof) onto a single vector (2 dof: angle and length), and so 4-2=2 dof remain.
This selection of vector fields paints a somewhat slanted view of the behavior of the network. The network navigates to cheese in many test mazes, but we wanted to exhibit seeds which illustrate competent pursuit of both the cheese and the path to the top-right corner.
Peli consulted with a statistician on what kind of regression to run. Ultimately, the factors we used are not logically independent of each other, but our impression after consultation was that this analysis would tell us something meaningful. Peli describes the statistical methodology:
Here are the factors we included in the initial regression, with the final four factors bolded with coefficients given:
Euclidean distance from cheese to top right cell (-2.786)
Euclidean distance from cheese to top right 5×5
Legal path distance from cheese to top right cell
Legal path distance from cheese to top right 5×5
Euclidean distance from ‘decision square’ to cheese (-0.623)
Legal path distance from ‘decision square’ to cheese (-1.084)
Euclidean distance from ‘decision square’ to top right cell
Euclidean distance from ‘decision square’ to top right 5×5 (1.326)
Legal path distance from ‘decision square’ to top right cell
Legal path distance from ‘decision square’ to top right 5×5
L2 norm of the cheese global coordinates (e.g. (0,10)↦10)
An example of the power of cheese Euclidean distance to top-right corner:
Note that this result obtains even though the second maze has cheese at 1√2 the visual distance (2 instead of 2√2) and at half the path-distance (2 instead of 4). Cheese tends to be more influential when it's closer to the top-right, even controlling for other factors.
EDIT 4/15/23: The original version of this post used the word "patch", where I now think "modification" would be appropriate. In many situations, we aren't "patching in" activations wholesale from other forward passes, but rather e.g. subtracting or adding activation vectors to the forward pass.
This was the first model editing idea we tried, and it worked.
Yes, this is cursed. But it's not our fault. Langosco et al. used the same architecture for all tasks, from CoinRun to maze-solving. Thus, even though there are only five actions in the maze (←,→,↑,↓,no-op):
- left and right are each mapped into by 3 network outputs,
- up and down by 1 each, and
- no-op is mapped into by the remaining 7 outputs.
This totals to a 15-element logit distribution. To get the action probabilities for the vector fields, we marginalize over the outputs for each action.
A given
embedder.block2.res1.resadd_outchannel activation doesn't neatly correspond to any single grid square. This is because grids are 25×25, while the residual channels are 16×16 due to the maxpools.For example, we hypothesize channel 55 to be a "cheese channel." We randomly selected channel 52 and computed resampling statistics. We found that channel 52 seems across-the-board less influential, even under totally random resampling (i.e. different cheese location):
By the time you hit the residual addition layer in question (
block2.res1.resadd_out), cheese pixels on the top-left corner of the screen can only affect 5⋅5=25 out of the 16⋅16=256 residual activations at that layer and channel.block2.res1.resadd_out. The plot shows the nonzero activations present halfway through the network due to the presence of a pixel in the top-left.This is because the convolutional nature of the network, and the kernel sizes and strides in particular, mean that convolutional layers can only pass messages one "square" at a time. There's no global attention at all, and no dense linear layers until the very end of the forward pass.
If the cheese were in the middle of the observation, the cheese pixels would affect 10⋅10=100 activations in this channel at this layer.