This is a linkpost for https://rootsofprogress.org/flying-car-ad
New Comment
This got me curious about how electricity prices have varied over that time period.
https://www.eia.gov/totalenergy/data/annual/showtext.php?t=ptb0810
Rough story (adjusted for inflation):
- Prices were decreasing until 1973
- Prices spiked with the oil shock
- They came back down to 1965-1970 levels by ~2000
- Since then have been tracking slowly upwards (up to 2010 at least)
For electricity, I don't think production and consumption are that different? Certainly not for the US
You mean this: https://ourworldindata.org/grapher/per-capita-electricity-consumption?tab=chart&country=GBR~USA~IND~CHN~FRA~Europe~DEU
I'm not sure for export-driven countries, but maybe.
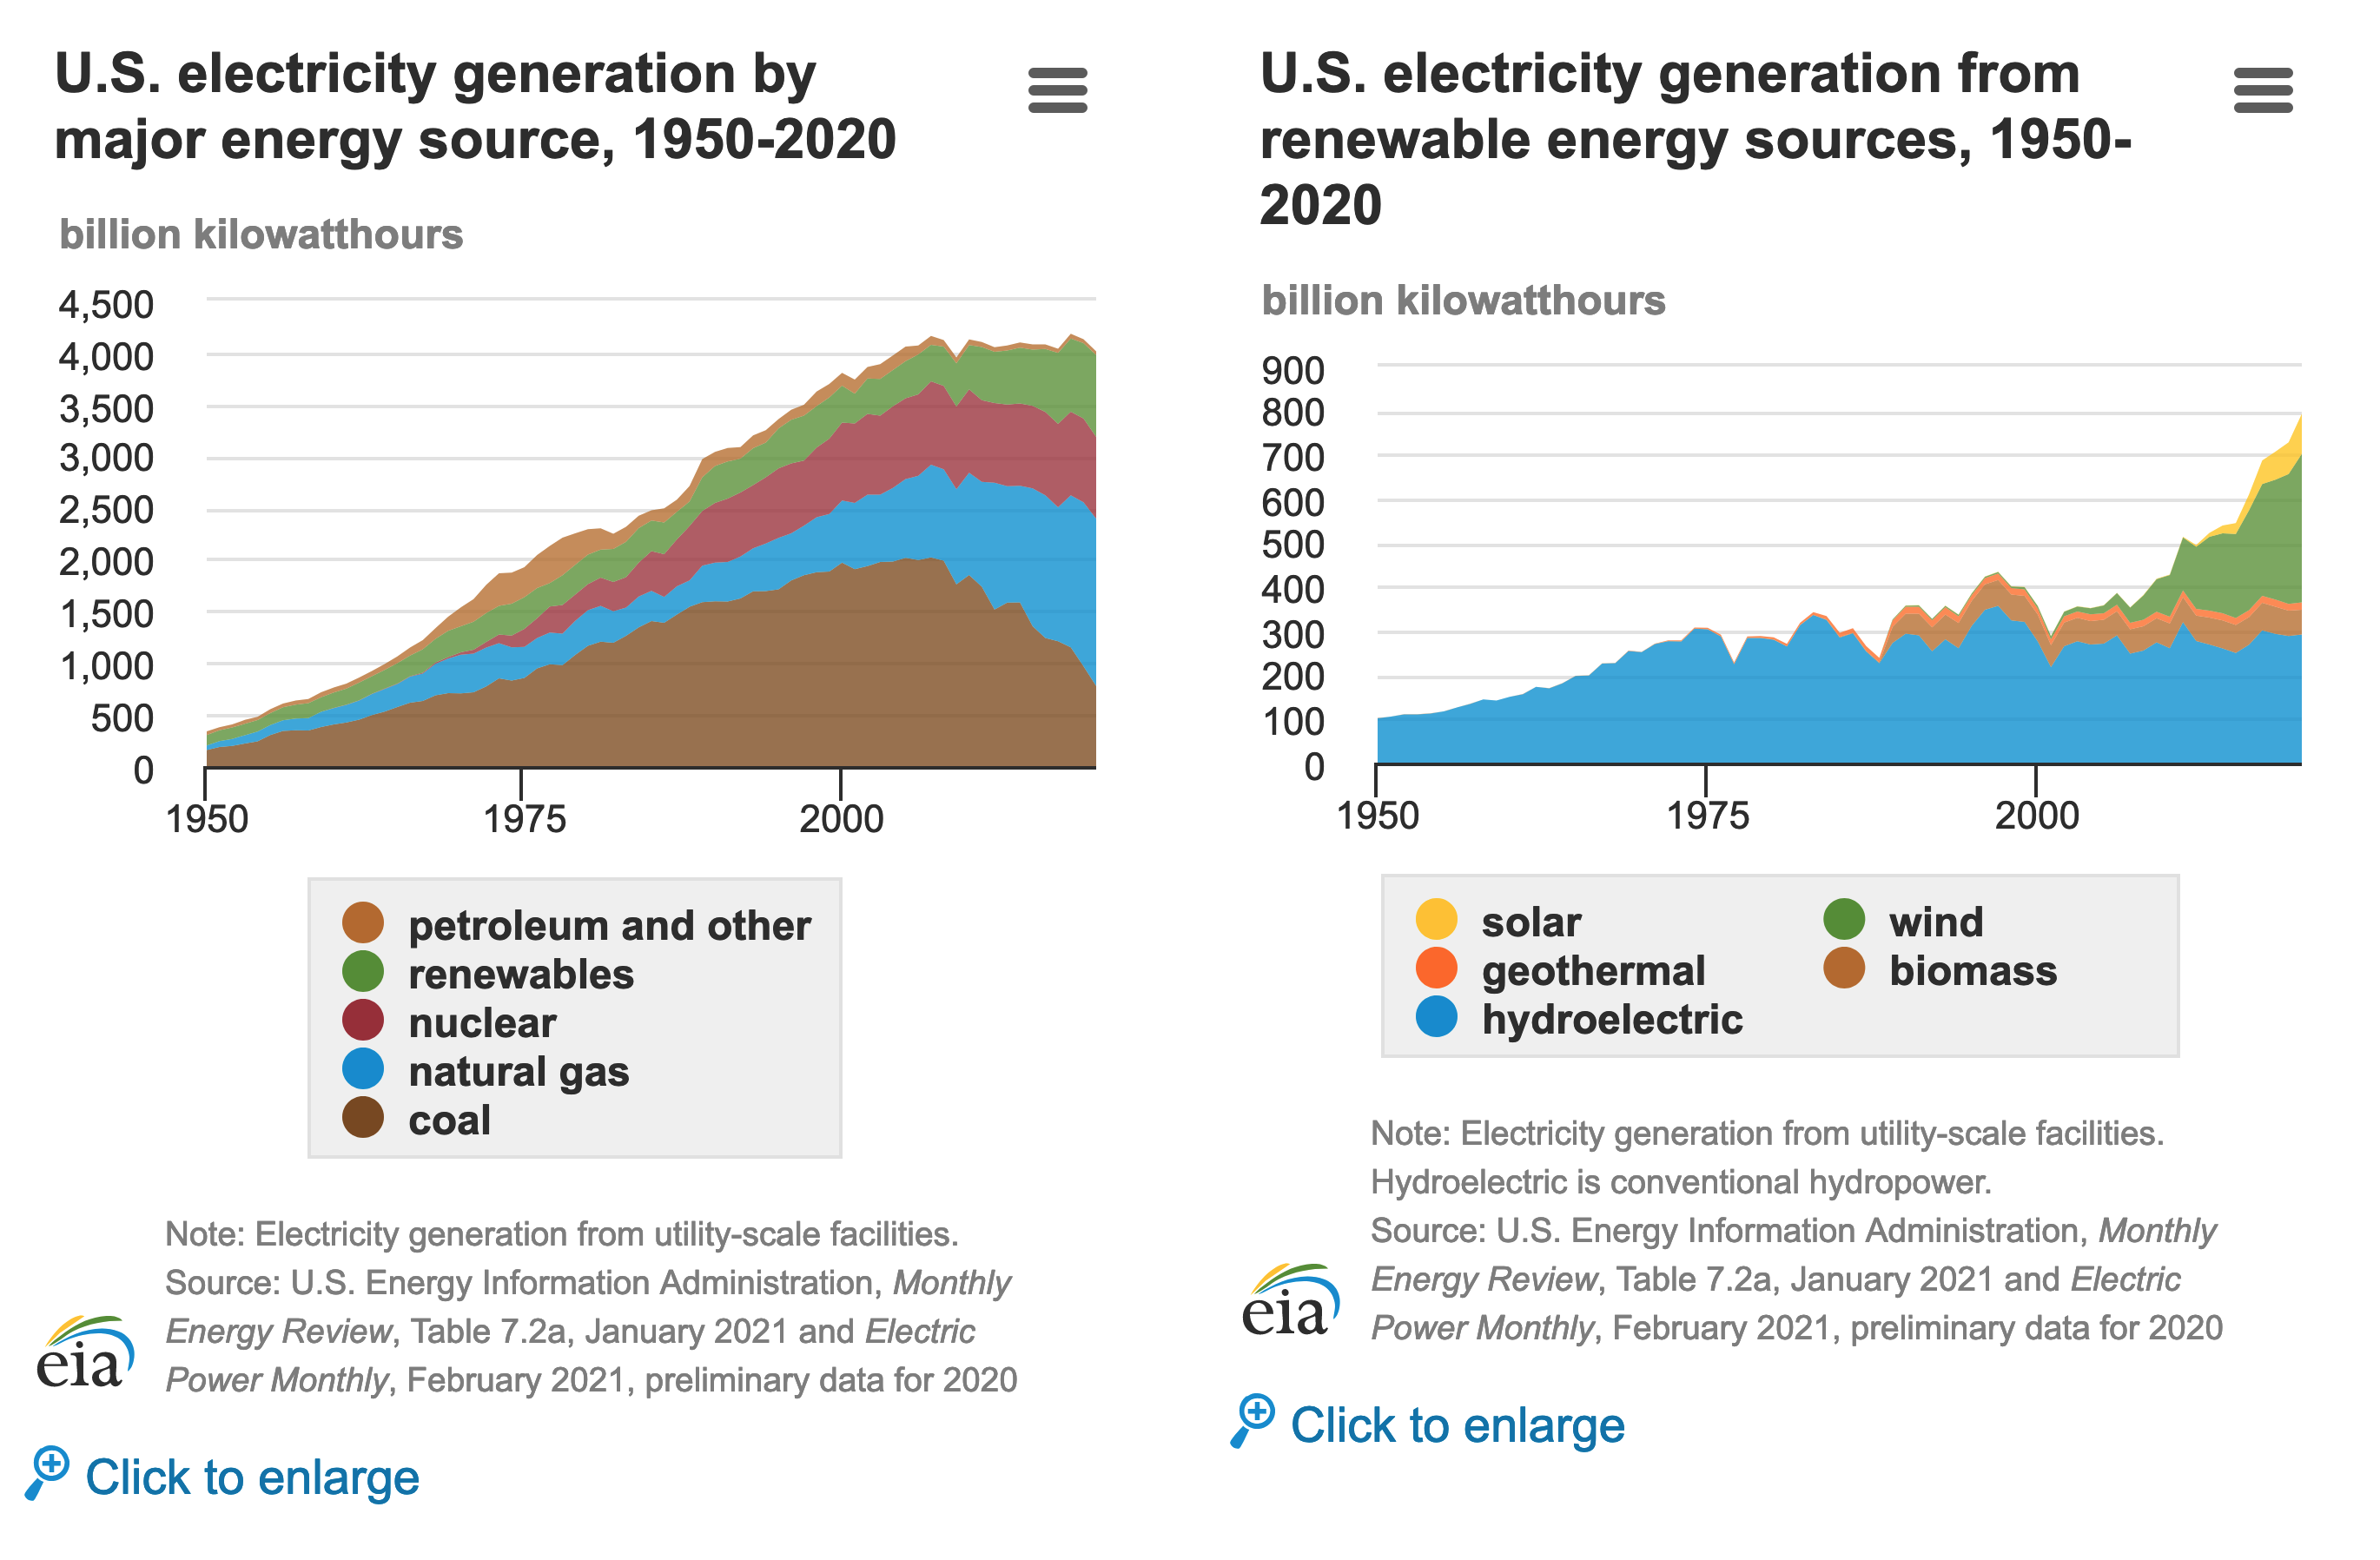
I found this last chart really interesting, so did some hunting. It looks electricity generation in the US grew linearly until around ~2000. In the last 10 years though, there's been a very large decline in "petroleum and other", along with a strong increase in natural gas, and a smaller, but significant, increase in renewables.
I'd naively guess things to continue to be flat for a while as petroleum use decreases further; but at some point, I'd expect energy use to increase again.
That said, I'd of course like for it to increase much, much faster (more like China). :)
https://www.eia.gov/energyexplained/electricity/electricity-in-the-us-generation-capacity-and-sales.php
It's interesting that you (and OP) think that growing electricity use per capita is good. I think it's a reasonable proxy for other kinds of growth in many situations, but what we care about is those other kinds of growth -- and given that there are negative externalities associated with electricity (pollution and climate change) and so there's been a concerted effort to be more efficient, using it as a proxy for growth is a lot more suspect over the past couple of decades.
I would probably want to measure something we care about directly rather than electricity use per capita, at least until something like fusion comes along.
To be clear, I care about clean energy. However, if energy production can be done without net-costly negative externalities, then it seems quite great.
I found Matthew Yglesias's take, and Jason's writings, interesting.
https://www.slowboring.com/p/energy-abundance
All that said, if energy on the net leads to AGI doom, that could be enough to offset any gain, but my guess is that clean energy growth is still a net positive.
I think it's still a pretty good proxy. Quantitatively, correlation between energy usage and GDP is pretty high, even at higher income levels. Qualitatively, many things that would greatly improve quality of life would also use lots more energy: supersonic air travel, nanotech, flying cars, etc.
In the last 10 years though, there's been a very large decline in "petroleum and other"
The colours are a bit confusing but I think this is actually a decline in coal usage.
I'd naively guess things to continue to be flat for a while as petroleum use decreases further; but at some point, I'd expect energy use to increase again.
The EIA have a projection here.
They estimate ~35% increase over the next 30 years, roughly linearly, with renewables doubling over that period and natural gas staying more-or-less the same.
but I think this is actually a decline in coal usage.
Ah, my bad, thanks!
They estimate ~35% increase over the next 30 years
That's pretty interesting. I'm somewhat sorry to see it's linear (I would have hoped solar/battery tech would improve more, leading to much faster scaling, 10-30 years out), but it's at least better than some alternatives.
If you look at the second-to-last chart, energy production was growing exponentially 1950–73, then about linearly 1973–2005, and then not growing at all after that.
When people say things like “we were promised flying cars,” I sometimes wonder, “who promised this?”
I guess this is what they mean. From a 1959 ad that ran in the LA Times:
“They’re working on it!” the ad claims. “Some of this is happening already.” (Implying, of course, that some of it was still pretty speculative.)
The ability to “dial” a book, lecture, or demonstration is here; the ultrasound dishwasher, automatic bed-maker, and flying car sadly are not.
But here’s what’s most interesting to me: First, the reference, without explanation or justification, to “tomorrow’s higher standard of living”—something people simply assumed was coming. Second, that it was uncontroversial that this higher standard of living would require more electricity. Finally, the boasting of doubling electricity production in ten years. As I’ve pointed out, society once had a different fundamental attitude towards growth.
The US did, in fact, approximately double electricity generation every decade from 1950 until 1973—the year of the oil crisis—after which electricity growth never really recovered. It took almost thirty years to double again, from 1973 to 2000, during which time it was just keeping up with population growth; that is, per-capita energy usage was not increasing. And since 2005, even the total amount produced has been flat:
“The electric companies are resolved,” the ad says, to maintain for America “the best electric power service in the world.” Well, we are still one of the top overall producers, second only to China:
But since the oil shocks, I’d say that “resolve” has been shaken.