Let me be an Excel sidekick among statistical analysis heroes.
I saw the OKCupid stuff as well, I ran a quick test in Excel to see if the variance in attractiveness contributes to the decision to meet beyond the attractiveness mean. Here's what I got doing regression, with apologies for the hideous formatting:
                  ......... Coefficients    ..Standard Error     ..t Stat        ..P-value

 Intercept    -0.569931558    0.042946471    -13.27074239    4.65749E-35

 avg_attr    0.156634411    0.005238302    29.90175402    2.6299E-117

 attr_std    0.028596624    0.012485497    2.290387431    0.022377128
The dependent variable is match percent (percent of people who decided they want to date the ratee), avg attr is the mean and attr std the standard deviation of the physical attractiveness ratings. attr std is not the attractiveness to STDs ;-)
As we can see, the coefficient for attractiveness deviation is significantishly positive. It actually has a small negative correlation with match and a larger negative correlation with attractiveness. This means that there is more consensus on the attractiveness of prettier people. Holding attractiveness constant, variance, which is visible for a single rater as an "unusual look", increases the chances that people will want to date you. Put some flowers in your hair!
Thanks :-).
I haven't looked at how the shapes of the distributions vary yet. The variability in standard deviations seems consistent with the phenomenon described in the OkCupid blog post, but I don't whether the high variance distributions tend to be bell curve shaped with larger standard deviations or bimodal.
What is true is that there was no statistically significant secondary dimension of attractiveness. One would find other dimensions if there were a sufficiently large number of people at the events, but it's unclear how large "sufficiently large" is – it could be 10 more people, or it could be 100 more people. I'll be writing more about this later.
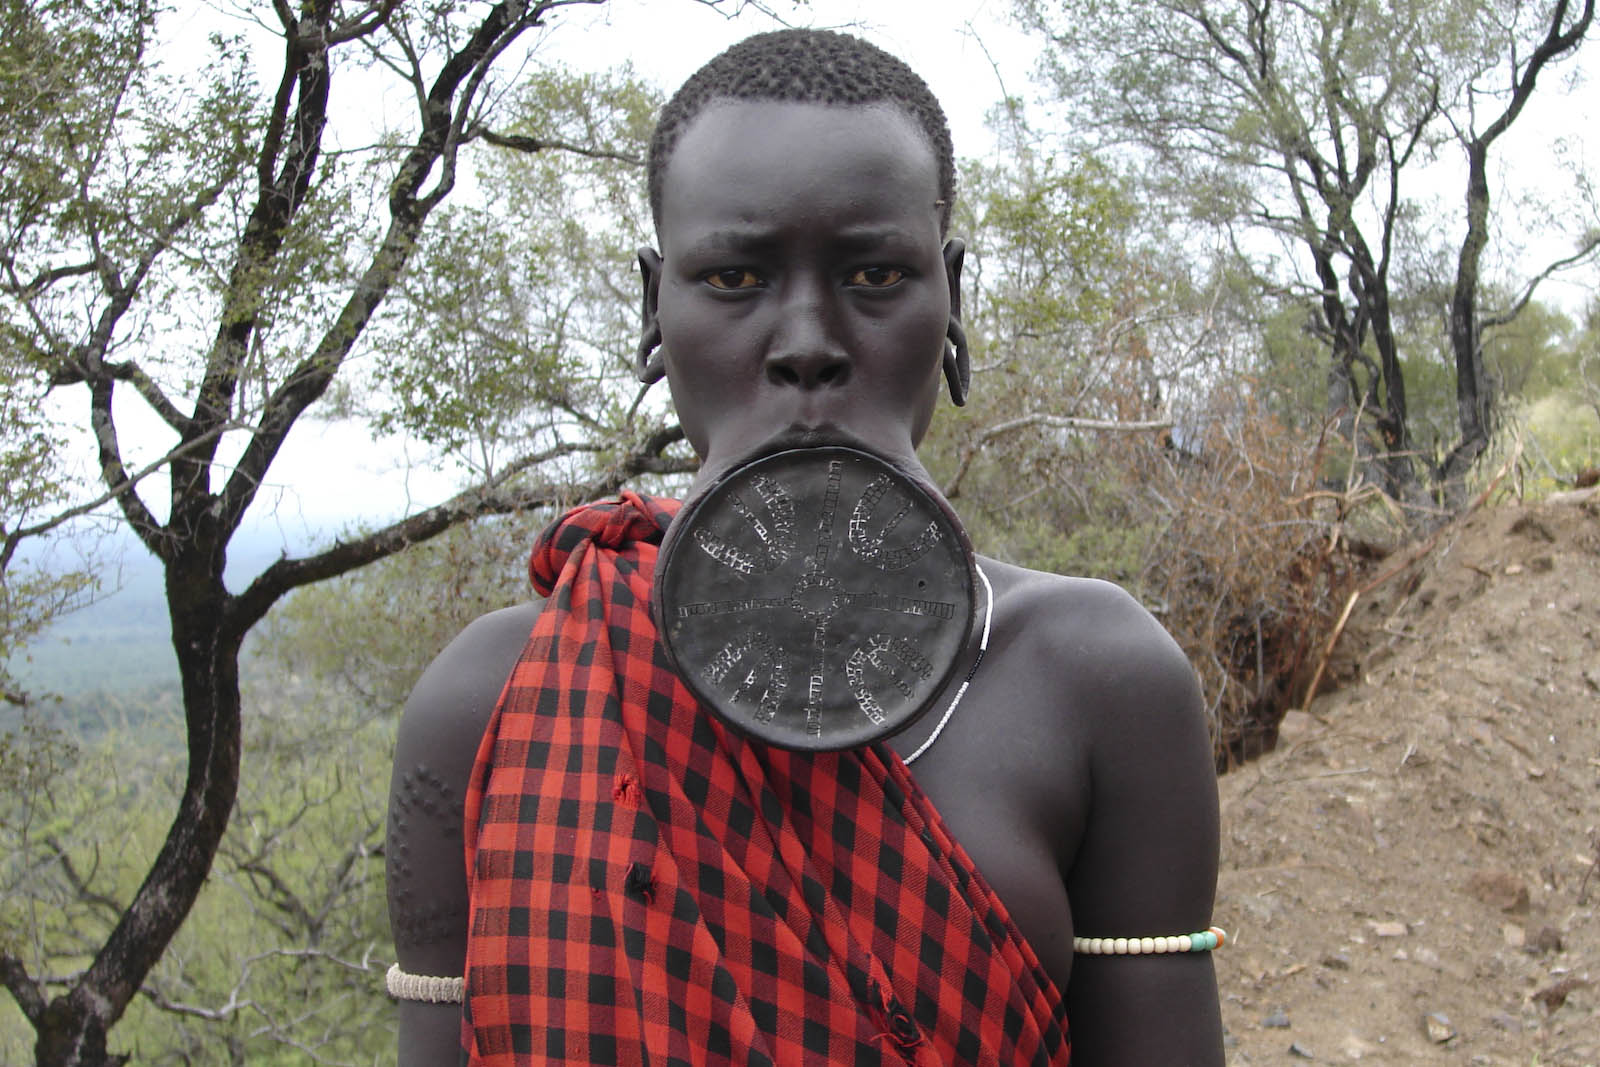
Undoubtedly, the homogeneity of the population studied also plays a role: if a woman with this facial adornment were at the event, and the event included some men from her culture, perceptions of her attractiveness would be extremely polarized.
Undoubtedly, the homogeneity of the population studied also plays a role: if a woman with this facial adornment were at the event, and the event included some men from her culture, perceptions of her attractiveness would be extremely polarized.
I hear this a lot, and the Mursi always used as an example.
I don't think attraction is that malleable. Personally, I suspect that as a culture the Mursi simply don't prioritize beauty. They have marriages which are arranged as children, with cattle as a medium of exchange. They probably don't think about sexuality the same way at all.
I don't think attraction is that malleable.
Certainly my intuition based on day to day experience and observations is the same, and alleged very large cultural differences are puzzling to me and I wouldn't be surprised if the matter were resolved in your favor.
But note that if nothing else, the example shows that cultures vary in what they consider to be obviously unattractive.
But note that if nothing else, the example shows that cultures vary in what they consider to be obviously unattractive.
That's not necessarily true - we don't need to look too far from our own culture to see intentional downplaying of attractiveness (modesty, "evil eye", etc)
I was gonna write more on this topic but then decided to just go and check what the anthropologists report the Mursi themselves say concerning lip plates:
http://www.mursi.org/pdf/latosky.pdf
Even after reading, it's still not quite clear.
My interpretation of this is that it's less about sheer beauty and more a way of being what in our culture we'd call "put together". A woman who does not wear her plate during the ritual periods when being put together is necessary is perceived as what we'd call "sloppy", and it would be associated with a lack of discipline in other areas of life. (It's also a tribal identity marker and a way to make money from tourists, of course)
The plate definitely maps onto something which is present in our own psychology, but I'm not at all convinced that it's attractiveness. I think you're right that it doesn't actively ruin attractiveness, which does indicate malleability.
(By the way, historically the anthropologists first thought it was an anti-rape measure (but the Mursi denied it), and then they thought it was a beauty mark which determined higher dowry (until it was discovered that dowry was set at birth). That second misconception is probably why it circulates on the internet as an example of divergent beauty standards. That's not to say that it isn't divergent beauty standards, but it's not just that.)
Day-to-day experience and observation can give you evidence that attraction isn't very malleable in adults. Do your experience and observation tell you anything about whether, e.g., who you end up being attracted to depends strongly on the people you see around you before age 5?
Related:
Is Kindness Physically Attractive?
The tl;dr version: The halo effect of beauty also works in reverse: if you start liking a person, they'll start to appear more physically attractive, as well.
Thanks for pointing out the article. My findings are in tension with the ones that the article reports on: I have an instrumental variables type argument based on the data in the opposite direction (which I'll write about soon), and I think the the phenomena in the speed dating data is more likely to generalize because it was collected in a real world setting rather than a lab.
On the other hand, anecdotally, it seems like the situation may be very different if one looks at perceptions based on interactions that occur over longer time horizons than 4 minute speed dates.
FYI, you have a sentence missing its end: “The standard deviations of the distributions are nearly identical: 0.6 points on a ”.
Also, I think the "refined estimate" plot would be improved by setting its x-axis scale to be the same as the previous plot (even though this would create empty space).
*There is a universal standard for beauty.
*Beauty is in the eye of the beholder.
Just putting this out there - beauty is in fact completely subjective, and there is no universal standard nor can there be one, HOWEVER, it seems to us like beauty is objective because humans are really genetically (and socially) similar to each other. This gives rise to preferences that are shared by large groups, and the illusion that the things which many people consider attractive are objectively beautiful.
Yes, I meant "subjective" in a colloquial sense (the way people use it in day to day conversation) rather than a philosophical sense.
It seems possible to me that there are standards of beauty that would cut across many different species of intelligent life (including extraterrestrials) out of virtue of there being similar evolutionary pressures across contexts: for example, I could imagine aliens typically viewing aliens with symmetric features as being more attractive than aliens with asymmetric features. But yes, it's in principal possible for an entity's conceptions of beauty to be completely orthogonal to those of humans.
Has anyone investigated this in non-human animals here on earth?
(... I realise that I have no idea how commonly, and how strongly, visual "attractiveness" is relevant to mating of non-human animals at all. Clearly at least sometimes it's at least quite relevant (consider, e.g., peacocks), but beyond that I'm pretty clueless. If you're reading this and know much more, please educate me!)
Consider the two statements:
Most people would agree that there's some truth to each of these statements. At Thing of Things Ozy wrote:
This post explores the question of the extent to which each of the two statements is true, using data from a study of speed dating events conducted by Raymond Fisman and Sheena Iyengar.
The basic facts that I describe here are:
There's much more to say about how to interpret the group consensus and its implications, which I'll go into in a later post.
Each event involved ~15 men and ~15 women, and everybody of a given gender went on speed dates with everyone of opposite gender. Each participant on each date rated his or her partner on a number of dimensions, including attractiveness, on a scale from 1 to 10. For the purpose of this post, I focused on how attractive raters found a ratee relative to other ratees. For this reason, I scaled each rater's ratings so that the averages are the same for all raters of a given gender.
Gender differences
One sees essentially the same phenomena when the raters are men and the ratees are women as one does when the genders are reversed. There is however one very important difference: the average of the ratings that men gave women was ~6.5, and the average of the ratings that women gave men was ~5.9. The standard deviations were the (interestingly) same in both cases, and in terms of standard deviations, women were rated 0.5 SD higher than men were. This fact may have profound ramifications. I've pictured the distributions of average attractiveness ratings of men and of women below:
The main difference between the distributions is that the one for women is shifted to the right relative to the one for men. The shapes of the distributions are also a little bit different, but one can verify that the difference within the range of what one would expect by chance.
Hierarchical modeling
We're interested in what the average ratings would be if a sufficiently large number of raters rated a given ratee.
The ratees who are rated highest and lowest are also the ratees whose ratings are most likely to be unrepresentative of the entire population's consensus on their attractiveness: there's regression to the mean.
A methodology that allows us to correct for this is Bayesian hierarchical modeling, which involves simultaneously estimating the "true" distribution of average attractiveness ratings of all hypothetical ratees together with the true average attractiveness ratings of the particular ratees in the dataset. The default assumption in Bayesian hierarchical modeling is that the true distribution is a normal distribution with mean and standard deviation to be determined. The histograms above suggest that this is close to being true in our setting.
If we use Bayesian hierarchical modeling to generate refined estimates for the averages, we get distributions that look something like the following:
Note that the in contrast with the actual averages, the refined estimates are never below 4.5 or above 8 – the participants weren't rated by enough people for us to be confident that any participant is that far away from average.
The standard deviations of the distributions are nearly identical: 0.6 points on the 10 point scale.
The distribution of ratings for a fixed person
The image below shows the ratings of 18 women by 17 men.
One sees that with the exception of the ratees in columns 10 and 16, all ratees had at least one rater who perceived her attractiveness to be noticeably above average and at least one rater who perceived her attractiveness to be noticeably below average.
The graph below shows the median rating (black), maximum rating (red) and minimum rating (blue) for all ratees in the study, together with best fit curves:
Here too, one sees that there are very few people who are consistently rated as being above average or below average.
This is consistent with the fact that the fact that the standard deviation of the ratings that an individual was given was roughly the same as the standard deviation of average ratings of the population of ratees. I've plotted the standard deviations for individual ratees below:
We see that the standard deviations have a strong central tendency, with mean equal to ~0.7 points.
The average standard deviation being 0.7 points overstates the variability in perceptions of an individual's attractiveness. Some reasons for this are:
In order to estimate the true standard deviation of the distribution of perceptions of a given person's attractiveness, I examined the relative predictive power of:
(i) Our refined estimate of the group consensus on ratees' attractiveness
(ii) The extent to which a rater's rating deviates from this estimate
in the context of predicting a rater's decisions as to whether or not to see a ratee again.
I found that 60% of the predictive power comes from the group consensus and 40% of the predictive power comes from deviations from the group consensus, suggesting that the standard deviation of variation in perceptions of a ratee's attractiveness is about 2/3 that of the standard deviation of the group consensus across ratees. In terms of points on a 10 point scale, this is about 0.45 points.
To be continued...
In subsequent posts, I'll describe how the data bears on the following questions: