Looking at these examples of "continuities" makes me think that the idea of continuity vs discontinuity is almost completely useless for AI risk, or tech/economics risk in general. The more people dig into developments and come out with some way to show that "actually, it was 'continuous' if you dig through enough archival materials and apply sufficient levels of hindsight and look at enough variables", the less it means anything. By the same arguments, stuff like the Industrial Revolution or coronavirus is 'continuous', because after all, some metric like number of cases follows a smooth continuous line on a graph; but does it feel like it was 'continuous' in the ill-defined sense that people are trying to use 'continuous' to stand for in AI risk discussions? It's hard to see how the fact that some tiny niche of researchers watched a number ramp up over a few weeks or years, without knowing the importance or long-term outcomes, thereby rendering it 'continuous' on some graph years later by third parties, is really all that useful or helpful.
A better question might be, were the effects discontinuous from the perspective of other large groups and particularly their decision-making functions (OODA loops). Like, say, was progress in large ships 'continuous' from the perspective of Tokugawa Japan or the Aztecs?
What? I feel like this comment doesn't answer to the post above at all.
tl;dr of the post: If I look at 50 technologies which to a first approximation I expect to be roughly randomly chosen, I can broadly divide them into:
- Probably with "big" discontinuities: Aviation, nuclear weapons, petroleum, printing, spaceflight, rockets, aluminium production, radar, radio, automobile, transistors, and PCR.
- Probably with "medium" discontinuities: cryptography, glass, rail transport, water supply and sanitation, diesel car, automation, television, steam engine, timekeeping devices.
- Probably with "small" discontinuities: cycling, furniture, robotics, candle making, sound recording, submarines, batteries, multitrack recording, paper, telescopes, wind power.
- Probably not discontinuous: ceramics, film, oscilloscopes, photography, artificial life, calendars, chromatography, bladed weapons, condoms, hearing aids, telephones, internal combustion engine, manufactured fuel gases, perpetual motion machines, motorcylces, nanotech, portable gas stoves, roller coasters.
Using that, I can sort of get a prior for the likelihood of "big" discontinuities; which falls between 8% (4/50) and 24% (12/50). I can also get a rough probability of a discontinuity per year (~1% if the technology ever shows one). All of this has caveats, outlined in the post.
***
Your first point, that if I paper-push hard enough I can make anything look continuous doesn't apply, because I'm not in fact doing that. For example, throughout WW2 there of were several iterations of the radar, each progressively less shitty, but progress was fast enough (due to the massive, parallel, state funding) that I'd still categorize it as a discontinuity (and note that it did get into the OODA loops of the Germans, the effectiveness of whose submarines greatly declined after the deployment of radar). Similarly, the Wright brothers also experimented with different designs, but overall their progress on heavier than air flight was rapid and anomalous enough that I categorized it as a discontinuity. Similarly, for transistors, there were of course many different transistors, but MOSFET transistors were substantially better on miniaturization than BJTs, even if MOSFETs were worse during their very first years. Similarly, transistors themselves were better than vacuum triodes, though I'm sure that if you squint you can also find something continuous somewhere.
Even if I were paper pushing, detecting 12/50 would still give you a lower bound for the probability of a "big" discontinuity (24% + however many I paper-pushed to the medium or small categories). Even if there wasn't a clear line between "continuous" and "discontinuous", I'd expect more continuous technologies to fall in the "medium", "small" and "probably not" buckets, and more discontinuous technologies in the "big" and "medium" buckets.
Some of your gripes could conceivably apply to some parts of AI Impacts' investigation (e..g, they don't categorize printing as a "large and robust" discontinuity), but I am not them.
Big fan of your work, though.
AI Impacts states: "32% of trends we investigated saw at least one large, robust discontinuity". If I take my 12 out of 50 "big" discontinuities and assume that one third would be found to be "large and robust" by a more thorough investigation, one would expect that 4 out of the 50 technologies will display a "large and robust discontinuity" in the sense which AI Impacts takes those words to mean.
This seems reasonable, but I think it may be too high. For the AI Impacts discontinuities investigation, the process for selecting cases went something like this:
-
All technologies <-- Select those which someone brings to our attention, thinking it might be discontinuous
-
Discontinuity candidates <-- Do some cursory research to see if they're worth investigating in more depth
-
Strong discontinuity candidates <-- Get data, calculate, and keep those with > 10 years of unexpected progress
-
Discontinuities <-- Select those that are particularly large and not highly sensitive to methodology
-
Large and robust discontinuities
That 32% statistic is the fraction of 3) that made it all the way to 5). It seems like your investigation corresponds roughly to calculating the fraction of 1) that makes it to 3). This is useful, because, as you explain, the AI Impacts investigation did not give us evidence about the overall prevalence of discontinuities. Of your list, 8 were things that we investigated, all of which you list as plausibly big discontinuities, except one that was 'maybe' and 'medium'. Of those, we found 3 to be discontinuous, and all of those three were deemed large and robust. So that's 42% if we ignore the 'maybe'.
This suggests that the 32% is too low. But the 42% above is the fraction of categories of technologies and lines of investigation that seemed very promising, and which showed at least one discontinuity somewhere. Some of these categories are quite broad (robotics), while some are rather narrow (condoms). Within those categories are many technologies, not all of which showed discontinuous progress. Supposing that all categories are equally likely to produce discontinuities, this suggests that the base rate is substantially lower, since even if discontinuities are very rare, we might expect most broad categories to contain at least one.
It is plausible to me that it is better to think of AI as one of these broad categories, especially since the potential discontinuities you're flagging do seem to correspond more to advances that substantially changed the field, and less to things that only advance one small corner of it. In that case, the 42% base rate is about right. But I'm not sure if this is the right approach, from an AI safety standpoint, since many discontinuities might be largely irrelevant while others are not. A discontinuity in performance for diagnosing cancer seems unconcerning, while a discontinuity in predicting geopolitics seems more concerning.
Nonetheless, this is interesting! I particularly like the idea of having multiple people do similar investigations, to see if the results converge. Another possibility is to spot check some of them and see if they hold up to scrutiny.
Note that 8 is pretty small, so if the true base rate was 32%, you'd still expect to see 2 discontinuities (8 choose 2) * 0.32^2 * 0.68^6 = 0.283 = 28% of the time, vs (8 choose 3) * 0.32^3 * 0.68^5 = 0.266 = 27% of the time for 3 discontinuities, so I take the 3/8 as indicative that I'm on the right ballpark, rather than sweating too much about it.
The broad vs specific categories is an interesting hypothesis, but note that it could also be cofounded with many other factors. For example, broader fields could attract more talent and funds, and it might be harder to achieve proportional improvement in a bigger domain (e.g., it might be easier to improve making candles by 1% than to improve aviation by 1%). That is, you can have the effect that you have more points of leverage (more subfields, as you point out), but that each point of leverage affects the result less (an x% discontinuity in a subfield corresponds to much less than x% in the super-field).
If I look at it in my database, categorizing:
- Broad: aviation, ceramics, cryptography, film, furniture, glass, nuclear, petroleum, photography, printing, rail transport, robotics, water supply and sanitation, artificial life, bladed weapons, aluminium, automation, perpetual motion machines, nanotechnology, timekeeping devices, wind power
- Not broad: motorcycle, multitrack recording, Oscilloscope history, paper, polymerase chain reaction, portable gas stove, roller coaster, steam engine, telescope, cycling, spaceflight, rockets, calendars, candle making, chromatography, condoms, diesel car, hearing aids, radar, radio, sound recording, submarines, television, automobile, battery, telephone, transistor, internal combustion engine, manufactured fuel gases.
Then broad categories get 24% big discontinuities, 29% medium discontinuities, 14% small discontinuities and 33% no discontinuities. In comparison, less broad categories get 24% big discontinuities, 10% medium discontinuities, 28% small discontinuities and 38% no discontinuities, i.e., no effect at the big discontinuity level but a noticeable difference at the medium level, which is somewhat consistent with your hypothesis. Data available here, the criteria used was "does this have more than one broad subcategory" combined my own intuition as to whether the field feels "broad".
perhaps because GPT-3 was maybe a discontinuity for language models.
??? Wasn't GPT-3 the result of people at OpenAI saying "huh, looks like language models scale according to such-and-such law, let's see if that continues to hold", and that law did continue to hold? Seems like an almost central example of continuous progress if you're evaluating by typical language model metrics like perplexity.
Seems like an almost central example of continuous progress if you're evaluating by typical language model metrics like perplexity.
I think we should determine whether GPT-3 is an example of continuous progress in perplexity based on the extent to which it lowered the SOTA perplexity (on huge internet-text corpora), and its wall clock training time. I don't see why the correctness of a certain scaling law or the researchers' beliefs/motivation should affect this determination.
I agree I haven't filled in all the details to argue for continuous progress (mostly because I don't know the exact numbers), but when you get better results by investing more resources to push forward on a predicted scaling law, if there is a discontinuity it comes from a discontinuity in resource investment, which feels quite different from a technological discontinuity (e.g. we can model it and see a discontinuity is unlikely). This was the case with AlphaGo for example.
Separately, I also predict GPT-3 was not an example of discontinuity on perplexity, because it did not constitute a discontinuity in resource investment. (There may have been a discontinuity from resource investment in language models earlier in 2018-19, though I would guess even that wasn't the case.)
Several of the discontinuities in the AI Impacts investigation were the result of discontinuities in resource investment, IIRC.
I think Ajeya's report mostly assumes, rather than argues, that there won't be a discontinuity of resource investment. Maybe I'm forgetting something but I don't remember her analyzing the different major actors to see if any of them has shown signs of secretly running a Manhattan project or being open to doing so in the future.
Also, discontinuous progress is systematically easier than both of you in this conversation make it sound: The process is not "Choose a particular advancement (GPT-3), identify the unique task or dimension which it is making progress on, and then see whether or not it was a discontinuity on the historical trend for that task/dimension." There is no one task or dimension that matters; rather, any "strategically significant" dimension matters. Maybe GPT-3 isn't a discontinuity in perplexity, but is still a discontinuity in reasoning ability or common-sense understanding or wordsmithing or code-writing.
(To be clear, I agree with you that GPT-3 probably isn't a discontinuity in any strategically significant dimension, for exactly the reasons you give: GPT-3 seems to be just continuing a trend set by the earlier GPTs, including the resource-investment trend.)
Maybe GPT-3 isn't a discontinuity in perplexity, but is still a discontinuity in reasoning ability or common-sense understanding or wordsmithing or code-writing.
I was disagreeing with this statement in the OP:
GPT-3 was maybe a discontinuity for language models.
I agree that it "could have been" a discontinuity on those other metrics, and my argument doesn't apply there. I wasn't claiming it would.
I think Ajeya's report mostly assumes, rather than argues, that there won't be a discontinuity of resource investment. Maybe I'm forgetting something but I don't remember her analyzing the different major actors to see if any of them has shown signs of secretly running a Manhattan project or being open to doing so in the future.
It doesn't argue for it explicitly, but if you look at the section and the corresponding appendix, it just seems pretty infeasible for there to be a large discontinuity -- a Manhattan project in the US that had been going on for the last 5 years and finished tomorrow would cost ~$1T, while current projects cost ~$100M, and 4 orders of magnitude at the pace in AI and Compute would be a discontinuity of slightly under 4 years. This wouldn't be a large / robust discontinuity according to the AI Impacts methodology, and I think it wouldn't even pick this up as a "small" discontinuity?
Several of the discontinuities in the AI Impacts investigation were the result of discontinuities in resource investment, IIRC.
I didn't claim otherwise? I'm just claiming you should distinguish between them.
If anything this would make me update that discontinuities in AI are less likely, given that I can be relatively confident there won't be discontinuities in AI investment (at least in the near-ish future).
Yes, but they spent more money and created a much larger model than other groups, sooner than I'd otherwise have expected. It also reaches some threshold for "scarily good" for me which makes me surprised.
Yes, but they spent more money and created a much larger model than other groups, sooner than I'd otherwise have expected.
My impression was that it followed existing trends pretty well, but I haven't looked into it deeply.
From the paper, charts such as:
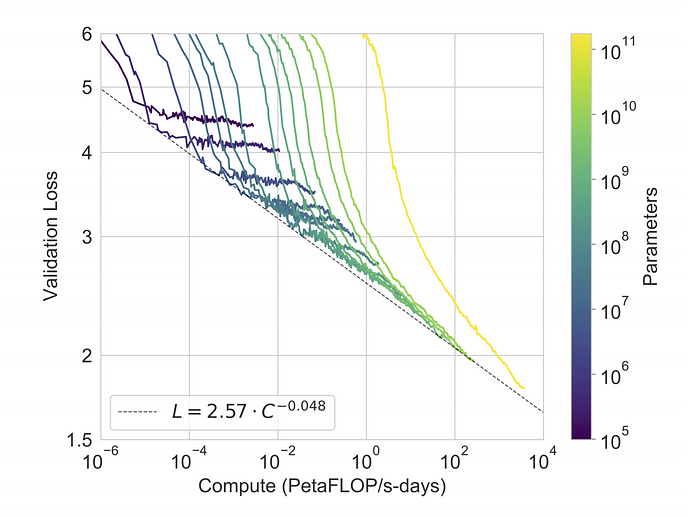 suggest that it wasn't a discontinuity in terms of validation loss, which seems to the inverse of perplexity.
Also, from the Wikipedia page:
GPT-3's full version has a capacity of 175 billion [parameters] [...] Prior to the release of GPT-3, the largest language model was Microsoft's Turing NLG, introduced in February 2020, with a capacity of 17 billion parameters or less than 10 percent compared to GPT-3.
The year before GPT-2 had 1.5 billion parameters and XLNET had 340M. The year before that, in 2018 BERT had 340M. Here are two charts around that time:


Unclear whether there was a discontinuity roughly at the time of Nvidia's Megatron, particularly on the logarithmic scale. GPT-3 was 10x the size of Microsoft's last model, but came 4 months afterwards, which seems like it might maybe break that exponential.
Of these 50 technologies, I think that 19 have a discontinuity, 23 might have one, and 18 probably don't.
19 + 23 + 18 = 60. What gives?
Persian calendar which doesn’t require leap days
This is news to me. We do have leap days every 4 years (called "Kabiseh" years).
Introduction
I looked at 50 technologies taken from a Wikipedia list History of technology, which I expect to provide a mostly random list of technologies. Of these 50 technologies, I think that 19 have a discontinuity, 13 might have one, and 18 probably don't. Of these, I'd call 12 "big" discontinuities, for an initial probability estimate of 12/50=24% I provide other estimates in the "More elaborate models for computing the base rate of big discontinuities."
Unlike some previous work by AI Impacts (or, for that matter, by myself), I am able to produce something which looks like a prior because I consider a broad bag of different technologies, and then ask which proportion have discontinuities. Previous approaches have specifically looked for discontinuities and found examples, thereby not being able to estimate their prevalence.
The broad bag of technologies I draw from was produced by Wikipedia editors who followed their own designs. They most likely weren't thinking in terms of discontinuities, and won't have selected for them. However, these editors might still have been subject to availability bias, Anglicism bias, etc. This might make the dataset mildly imperfect, that is, not completely representative of all possible technologies, but I’d say that most likely it’s still good enough.
Furthermore, I didn't limit myself to discontinuities which are easily quantifiable or for which data is relatively easy to gather; instead I quickly familiarized myself with each technology in my list, mostly by reading the Wikipedia entry, and used my best judgement as to whether there was a discontinuity. This method is less rigorous than previous work, but doesn't fall prey to Goodhart's law: I want a prior for all discontinuities, not only for the quantifiable ones, or for the ones for which there is numerical data.
However, this method does give greater weight to my own subjective judgment. In particular, I suspect that I, being a person with an interest in technological discontinuities, might produce a higher rate of false positives. One could dilute this effect by pooling many people's assessments, like in Assessing Kurzweil’s predictions for 2019.
All data is freely available here. While gathering it, I came across some somewhat interesting anecdotes, some of which are gathered in this shortform.
Many thanks to Misha Yagudin, Gavin Leech and Jaime Sevilla for feedback on this document.
Table of contents
Discontinuity stories
One byproduct of having looked at a big bag of technologies which appear to show a discontinuity is that I can outline some mechanisms or stories by which they happen. Here is a brief list:
More elaborate models for computing the base rate of big discontinuities.
AI Impacts states: "32% of trends we investigated saw at least one large, robust discontinuity". If I take my 12 out of 50 "big" discontinuities and assume that one third would be found to be "large and robust" by a more thorough investigation, one would expect that 4 out of the 50 technologies will display a "large and robust discontinuity" in the sense which AI Impacts takes those words to mean. However, I happen to think that the "robust" here is doing too much work filtering out discontinuities which probably existed but for which good data may not exist or be ambiguous. For example, they don't classify the fall in book prices after the European printing press as a "large and robust" discontinuity (!).
I can also compute the average time since the first mention of a technology until the first big discontinuity. This gives 1055 years, or roughly 0.001 per year, very much like AI Impact's numbers (also 0.001). But this is too high, because printing, aluminium, aviation, etc. have millenarian histories. The earliest discontinuity in my database is printing in 1450, and the next one after that the petroleum industry in 1850, which suggests that there was a period in which discontinuities were uncommon.
If we ignore printing and instead compute the average time since either the start of the Industrial Revolution, defined to be 1750, or the start of the given technology (e.g., phenomena akin to radar started to be investigated in 1887), then the average time until the first discontinuity is 88 years, i.e., roughly 0.01 per year.
Can we really take the average time until a discontinuity and translate it to a yearly probability, like 1% per year? Not without caveats; we’d also have to consider hypotheses like whether there is a minimum wait time from the invention until a discontinuity, whether there are different regimes (e.g., in the same generation as the inventor, or one or more generations afterwards, etc.). The wait times since either 1750 or the beginning of a technology are {13, 31, 32, 47, 65, 92, 100, 136, 138, 152, 163}.
Adjustment for AI
So I have a rough prior that ~10% of technologies (4 out of 50) undergo a "large robust discontinuity", and if they do so, I'd give a ~1% chance per year, for an unconditioned ~0.1% per year. But this is a prior from which to begin, and I have more information and inside views about AI, perhaps because GPT-3 was maybe a discontinuity for language models.
With that in mind, I might adjust to something like 30% that AI will undergo a "large and robust" discontinuity, at the rate of maybe 2% per year if it does so. I’m not doing this in a principled way, but rather drawing on past forecasting experience, and I’d expect that this estimate might change substantially if I put some more thought into it. One might also argue that these probabilities would only apply while humans are the ones doing the research.
Conclusion
I have given some rough estimates of the probability that a given technology's progress will display a discontinuity. For example, I arrive at ~10% chance that a technology will display a “large and robust” discontinuity within its lifetime, and maybe at a ~1% chance of a discontinuity per year if it does so. For other operationalizations, the qualitative conclusion that discontinuities are not uncommon still holds.
One might also carry out essentially the same project but taking technologies from Computing Timelines and History of Technology, and then produce a prior based on the history of computing so far. I'd also be curious to see discussion of the probability of a discontinuity in AI in the next two to five years among forecasters, in the spirit of this AI timelines forecasting thread.