As the saying goes, “it’s time in the market, not timing the market”. There is a lot of research that says that market timing is incredibly difficult and most people fail to do it successfully.
https://www.forbes.com/sites/simonmoore/2016/03/07/the-myth-of-market-timing/
Also your assumption that the fed will raise interest rates to control inflation assumes that low inflation is their actual goal rather than just their stated goal. This months ARP newsletter has an excellent analysis of why higher inflation might be their desired outcome : https://www.arpinvestments.com/arl/why-much-wealth-must-be-confiscated
Furthermore, if you have already sold all your stocks, you are already sitting on a potential 30% gain if your assumptions play out. Shorting the market is a high risk leveraged strategy that could leave you with large losses if the market goes sideways, or continues to rise over the next months.
To be clear I do think that a significant market correction is coming, however as someone who tried (and failed) to successfully time investments during the dotcom bubble and in much of the decade after, I am much more comfortable being fully invested, knowing that whatever happens short term, this is the easiest, and lowest risk way (for me - based on my investment profile and personality) to maximise my returns long-term.
Good luck in any case!
Yeah, that's exactly how I look at it: The benchmark is the index, not cash. So I would see it as a 30 percent gain. But I figure that either I need to recalibrate my odds, or I need to make a bet that maximises long-run growth based on my credences. I don't think holding cash is optimal.
Well aware of the risks, but I'd kick myself if I were right and didn't act. I'm buying puts so the limit is the initial investment. Can't go bankrupt.
Good luck in any case!
Thanks, mate.
"Yeah, that's exactly how I look at it: The benchmark is the index, not cash. So I would see it as a 30 percent gain."
Why? If you are right you have 100% compared to 70% someone has who's position has lost 30%. Isn't that 42.9% more?
It is 2022-10-16, roughly one year after the post was made. The S&P 500 has not dropped below 3029 at any point. It is currently at its lowest value since the post was made at 3583.
https://www.spglobal.com/spdji/en/indices/equity/sp-500/#overview
Yep, down from 4327 at the time of posting, but not down enough for my prediction to be correct.
As far as I can tell, the main issue with my prediction was the Fed moving soooooo slllllooooow to increase interest rates, past the point of utter delusion on their part. Not only does this mean delaying the market crash, it means the dollars in which they are valued were worth less (meaning higher stock prices than they would've been with less inflation).
If I'm charitable to myself, I'd say right in direction, wrong in magnitude. And potentially only wrong in time frame, if it does drop below 3029 over the next few years.
But there's other things I missed, like Russia invading Ukraine. And even if I knew that was likely, I wouldn't have predicted the West's massive financial sanction response. But though much of the inflation blame got put onto the war, inflation was high before the invasion. I also should have looked into the past performance of the Fed to see how late to the party they've previously been.
I've been doing some backtests to get more accurate investment decisions. Will do an update when I'm happy with my methodology.
Did you make money from your positions? Being wrong about timing and magnitude but right in direction is, most of the time in investment, the same as just being plain wrong. There are plenty of known bubbles, but people lose money with puts all the time by getting the timing wrong.
I don't see interest rates rising fast enough to produce a decline this sudden. This looks more like a situation where stocks with high price / earnings and price / sales rations will underperform for a decade.
I see an above-average risk of a 5% drop over the next few weeks.
I don't see a major housing bubble in China. Their enormous savings rates and strong attachment to home ownership make it hard to compare their housing numbers to other countries. If there's a housing slowdown, it's more likely due to government panic than to homebuyer mistakes.
If someone knows the best way for an Australian to buy US Put options, please let me know.
I'm not certain, but I've heard this has been possible with Interactive Brokers at reasonable rates. https://interactivebrokers.com.au
There are also some alternatives to directly buying index options worth considering.
The SWAN and ISWN ETFs are insured, but still have ~70% exposure to the upside. They do this by holding 90% bonds and using the other 10% to buy LEAPS calls with a Delta of 70, which are synthetically equivalent to a married put position (with puts at a Delta of -30). If you replace some of your portfolio with these, it would probably handle the next bear market better.
If you want more than the 70% upside, you can replace more of your shares with the LEAPS yourself. Be careful not to over-leverage with LEAPS. The idea is to replace portfolio exposure with something cheaper, so not as much money is exposed (but with similar upside), not to increase exposure when you're expecting a bear market.
Shorting an ETF that sells puts (like PUTW) is like buying puts. (There are also several ETFs that write covered calls, like XYLD, which are synthetically equivalent to selling puts.) Beware of dividends and borrowing fees. Insurance is not free.
For the tail risk, consider the VXTH index's strategy of buying VIX calls. I don't think there's an ETF for this index currently. You'd have to implement the strategy yourself.
And finally, hedging with something uncorrelated to the stock market is good for a long-term portfolio anyway. When you rebalance to your target allocations after a crash, you usually end up buying stocks low and selling the hedge medium to high. 7-20+ year Treasury bonds are a decent investment in their own right, but have actually been anti-correlated with the stock market due to the flight-to-safety effect. Gold, TIPS, and utilities also make good hedges. (Real estate has also been used, but this is a questionable choice, especially if you already own a house.) Diversification is probably wise.
VIXY does have the advantage of being more granular than the VIX calls. But it also has a strong negative drift. If you hold very much of this, you will lose money quickly. Just look at the chart. Insurance is not free. I actually hold a small amount of the inverse fund, SVXY, most of the time due to its strong positive drift. (Small because of its strong negative skew). I'd say hold no more than 1-3% VIXY in a portfolio for tail insurance. The VXTH weighting schedule is also applicable to VIXY. VIXY probably isn't going to pay you much if the VIX is too high or too low.
NTSX has good tax efficiency, but it holds 90% stocks outright and 10% in 6x leveraged bond ladder, kind of the opposite of SWAN. That means you're still exposed to the tail in a bear market. SWAN is better insurance. You literally can't lose more than 10% on the LEAPS in a short period. The bond component is a separate question, but it tends to have good anticorrelation.
NTSX or leveraged ETF balancing strategy or even SWAN to some extent - All of these are prone to losses when the interest rates rise and more prone to losses when interest rates are raising rapidly . In such scenarios bonds and equity loose together and historic negative correlations might temporarily align positively. DRSK is one interesting ETF which can be thrown into the mix similar to SWAN ,Their fixed income portion is not duration heavy compared to other tail risk strategies like SWAN and their options are actively managed
However the biggest holy grail of risk management is to find an allocation/asset which can loose very little in normal times and gain maximum during crisis irrespective of the nature of crisis. Short duration bonds can satisfy the first condition, that is loose small on normal times but they don't gain the maximum in crisis. Long duration leveraged bonds can help with gains to certain extent but will loose when the interest rates are rapidly rising
The ones who have found the holy grail can actually leverage and make a ton of money in the market with peace. I can guess Volatility is definitely a component in this holy grail strategy , but what we are missing is how to time it.
For the CCP to declare themselves as “Communist” means they are likely to disregard much granularity that good policy must have
The fact that North Korea someone publically declares themselves to be democratic in the name of their country. That tells you little about how it's actually governed.
In the last decades the CCP seems to have had an enough people who understand the free market well enough to allow it to operate in a way that produces growth for China.
To the extend that Xi consolidates power I don't think that the word Communism helps you a lot to understand what's happening.
The fact that North Korea someone publically declares themselves to be democratic in the name of their country. That tells you little about how it’s actually governed.
Actually, it tells you a lot. Countries with “democratic” in the name are probably far less democratic than nations without it. The point I was making was that calling yourself something conveys information, depending on what you call yourself. Calling oneself communist has a positive correlation with other countries who called themselves communists. Whether they behave according to the ill-conceived utopian ideology doesn’t really matter, what matters is that we can increase our credences that they will behave in certain ways. Clearly, this is dependent on subject: Calling oneself a good driver probably conveys very little information. So, you can’t dismiss it based off counterexamples in different areas. Otherwise, you could say that since people who claim to always tell the truth sometimes don’t tell the truth, someone who claims to sometimes lie might be lying about lying (which is a ridiculous conclusion).
To say that calling oneself communist contains no information at all seems extremely unlikely to me, just based on all the other countries that have done so, even if I didn’t know of the recent changes in China. I’ve become more confident in this view from listening to people who can read and speak fluent Chinese and who have lived there for over a decade, and who saw first-hand the rolling back of free market rules.
To change my mind about communism not providing any info, you’d have to show how you built your reference class to reach that conclusion.
This would make sense if China was a black box of which we only knew the official name.
ETA: The point being that we have tons and tons of much more relevant evidence on their behavior than what they chose to call themselves 100 years ago.
Exactly, which is why I looked further into it:
When you have a government that identifies as Communist, that’s a threat that needs to be taken seriously. The evidence I’ve looked at this threat to evaluate this threat is anecdotal…
It’s a perfectly reasonable jumping off point to get into the specifics. I agree that if you have a more specific reference class, you should use it (I’ve made that point myself before, “holding your IQ test results in your hand and refusing to read it because ‘The average is 100, so I probably got 100’”).
For the CCP to declare themselves as “Communist” means they are likely to disregard much granularity that good policy must have
I think this claim has aged pretty well. Do you still disagree with this statement?
I don't think the problem with China's COVID policy is disregard for granularity. Zero COVID used to be a good strategy but now it doesn't. The problem isn't that the zero-COVID strategy lacks granularity but that a strategic change would be necessary given the higher transmissibility of the Omicron variant.
That strategic change doesn't happen because of the sunk cost bias and because powerful people have their careers invested in the strategy. I don't think the strategic change doesn't happen because China's leadership believes that changing the strategy would go against communist ideals.
Again, as I mentioned in my earlier response, ideals don't have anything to do with the claim. The claim is that countries that call themselves communist make large policy errors more frequently due to heavy-handed policies. The thing you label yourself with provides some information. That information might be contrary to what you want to portray (as in the case of countries with "democratic" in their name), but it's valid Bayesian information nevertheless.
Changing policy based on different circumstances is certainly part of granularity. It's granularity with respect to time and circumstance.
Ah well, hoped to bring you over, but I'll agree to disagree.
I see only one big policy error. If you argue that China frequently made policy errors in the last year, what errors do you see besides COVID-19 policy?
I see some worrying trends too. The issues cited above but also the growing domestic conflicts in the USA, and more populism, authoritarianism including suppression of 'wrong-think'. I did change my portfolio recently but didn't liquidate it. I wonder whether these are temporary effects or the first sign of limits to growth.
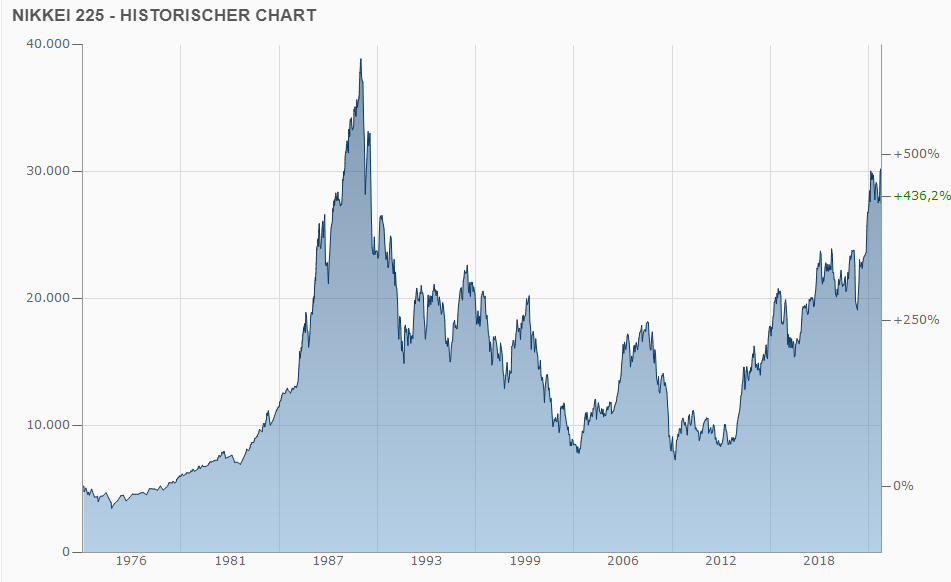
In the end, stock market growth seems to be driven by population growth [citation needed]. My model for what happens when population stagnates is Japan. Their working population peaked and leveled off around 1990.
I'm not sure what to invest in in a world without population growth. Probably tech. I will have to read 1960 the Year the Singularity was Cancelled again.
I think an easiest way to short SP500 is via inverse ETFs: https://etfdb.com/etfs/inverse/equity/
These move in opposite direction compared to the particular index (times 1/2/3 depending on type).
A counter point could be that due to cheap index ETFs and the prevalence of passive investing it is possible that in general a lot of metrics will have a higher base level. This has happened before, e.g. before the 90s, CAPE of 20 was quite high, but since that time it seems more of a base level (we haven't been below 20 since 2010). In particular: highest before 2008 crash was a bit above 27. We are above that since Dec 2016. https://www.multpl.com/shiller-pe/table/by-month
So main argument (based on high CAPE levels) was true almost five years ago. The same is true for a lot of other metrics:
Margin to debt was 3% in Jan 2017: https://www.gurufocus.com/economic_indicators/4266/finra-investor-margin-debt-relative-to-gdp
Interest rates were also pretty low (though not this much, but still very low compared to pre 2009 levels): https://www.macrotrends.net/2015/fed-funds-rate-historical-chart
and inflation (though still consistently below 3% all year) was clearly higher than in the preceding 4 years: https://www.usinflationcalculator.com/inflation/current-inflation-rates/
So, my question is: in a counterfactual world in February 2017, if I were to argue based on above data that you should move from equity to bond/cash/short positions as I am expecting 30% drop in US stocks within 2 years, how would you know that it was still to early?
A counter point could be that due to cheap index ETFs and the prevalence of passive investing it is possible that in general a lot of metrics will have a higher base level.
I completely agree. I made that point in the post (“Note that there could be reasons why the CAPE and PS ratios might not return to their historical average, e.g. increased savings chasing investments, which are not perfectly elastic. There may be risk of persistent inflation, which stocks hedge against.”)
I’m not basing this off of any one indicator. When inflation rose, that made every indicator I was looking at go bearish. I have this position because of the combination of all of these things, plus some other things I didn’t write down (indications of mania, like investment in zero-NPV “assets”). Price to sales ratios, which don’t have the same problems as PE ratios, are about 50 percent higher than it’s ever been. Margin-to-debt was 3 percent, yes, and now it’s nearly 4 percent, which is 33 percent higher.
The main thing I’m worried about is increased savings. (Second is persistent inflation without a corresponding increase in interest rates, but the Fed would have to be insane to do that, even if they are “overly optimistic” about future inflation.) As I said, 65 percent chance, not a guarantee. I could be wrong for some reason.
So, my question is: in a counterfactual world in February 2017, if I were to argue based on above data that you should move from equity to bond/cash/short positions as I am expecting 30% drop in US stocks within 2 years, how would you know that it was still too early?
Good question, essentially you’re asking for backtesting. If it helps, I didn’t short the market back then. I’d have a much lower credence because those indicators that I’ve mentioned weren’t at record levels across the board. Except in exceptional circumstances, go long on the market.
Thank you.
I understand the key issue with the Fed (and correspondingly other actors) misjudging inflation while being highly leveraged, and I do see it as a very good point in the current situation. If we were to see inflation going back to levels expected by the Fed (2-3% I suppose?) how would that change your forecast?
When you wrote "The main thing I’m worried about is increased savings" did you mean what you described in the previous paragraph (e.g. zero-NPV assets investing and alike), or was it something else?
If we were to see inflation going back to levels expected by the Fed (2-3% I suppose?) how would that change your forecast?
Great question. So my view is that there could be a few potential triggers for a sell-off cascade (via some combination of margin calls and panic selling), leading to a large drop. There’s also a few triggers for increasing interest rates, not just inflation: The Fed doesn’t have a monopoly on rates. When they buy fewer bonds, they shift the demand curve left, decreasing the price, leading to higher effective interest rates. I’m kind of baffled that they speak about “tapering” as if it’s possible to do so without increasing interest rates.
The particular problem with persistent inflation is that the Fed is less able to increase the cash supply in the event of a large crash. So while I think that inflation isn’t necessary for a 30 percent drop (I’d say it’s over half of my credence), I expect it to magnify the downside if it is higher than normal right before a crash.
Interestingly, the Fed itself was (and probably still is) concerned about the current high valuations.
When you wrote “The main thing I’m worried about is increased savings” did you mean what you described in the previous paragraph (e.g. zero-NPV assets investing and alike), or was it something else?
When I say zero-NPV assets, I mean anything that doesn’t pay out future cash flows to investors, like gold, silver, bitcoin, and NTFs. Certain stocks are being traded as if they were these assets too (AMC, GameStop). I think investment in these things is indicative of mania.
I’m worried that the Fed has flooded the market with so much cash that the new normal for the CAPE ratio and PS ratio are close to what they are now. If it is, then margin-debt-to-GDP isn’t the relevant ratio anymore, margin-debt-to-total-market-cap is, which is not at as high of a level as margin-to-GDP. Basically, supposing we have a smooth exponential curve for the S&P 500, I’m worried about a one-off discontinuity in the graph. I’m also worried about people investing more of their income and net worth, which would have the same effect.
I think an easiest way to short SP500 is via inverse ETFs: https://etfdb.com/etfs/inverse/equity/ These move in opposite direction compared to the particular index (times 1/2/3 depending on type).
I’m fairly sure that’s not the most efficient way to bet on this belief. The payoff is linear. So if I bet on the market going down 99 percent, I’d make 99 percent (or 3x that if the ETF is 3x leveraged), whereas the options bet payoff would probably be over a billion to 1.
Where are you getting a billion to 1 odds for the options bet payoff of the S&P going down 30% in the next year? Because if that's true, I'd invest a thousand dollars in that and have a solid chance at becoming a trillionaire.
No, it is certainly not the most efficient, but it is the easiest to execute: if you have a brokerage account, you can just buy an inverse ETF and you are in a (leveraged) short position.
I’m only interested in large trading platforms, rather than betting with individuals. But I guess if you’ve got a way to guarantee it, send me a private message.
If someone knows the best way for an Australian to buy US Put options, please let me know.
This post is somewhat unfinished, unedited, and much less detailed than I wanted it to be due me changing jobs.
Empirical prediction
My credence that the S&P 500 index will drop below 3029 at some point before this time next year, i.e. over a 30 percent decrease from current levels (at the time of writing), is much higher compared to both the market’s likely estimate (because rational investors would sell their stocks if they thought the index was overvalued at the current level, which at the time of writing is 4327) and compared to my base rate of such large crashes. If I had to estimate my current credence of a 30 percent devaluation happening within the next year (i.e. before July 16, 2022), I’d put it at around 65 percent.
Caveats
As you might see from the dates being behind the date at which this was posted, I’ve been writing this for a while. I’ve delayed posting this because I can’t fully justify the probabilities I’m assigning. I take methodology quite seriously (i.e. how do I know that my line of reasoning reliably leads to true conclusions), so I hate filling out my argument with weakly justified back-of-the-napkin calculations and gut feelings. But that’s all I’ve got here. So take everything I’ve written with a grain of salt.
The market actively fights any prediction. If an indicator of a future market movement is found, it will tend to become less effective over time, as other people learn to adjust their bets to accommodate that information. This means that all of my justifications based on historical data could be very wrong. I’ll be careful to, in each of these instances, give you reasons why a particular historical indicator might not indicate what it once did (note: ran out of time to do this).
To be clear, this is not financial advice. This is an empirical prediction with a justification that might have critical errors. I’m not a permabear, but I think the market conditions are heavily weighting the probability distribution of returns on the negative side of graph. To give you an idea of my confidence in my prediction, I sold all my stocks on 12 July 2021; the week after, I explained my position to some of my loved ones, and they sold their retirement stocks and held cash soon after; currently, I am deciding how to safely execute a large short position. So if I’ve made a mistake in my prediction, let me know.
The base rate of a now-to-trough drop of 30 percent
To calculate my base rate for a greater than 30 percent drop, I used the daily S&P 500 data since January 1986 (roughly when US inflation and US interest rates stabilized). (This data simply tracks the index without reinvested dividends, which is not ideal). On any random date since then, the probability of more than a 30 percent decrease at some point during the next year is 6.1 percent. This was way higher than I expected, so let me be extremely clear on what it means.
Put your left index finger on a random point on the S&P 500 graph between January 1986 and July 2020. Put your right index finger on the graph a year later. Put a thumb at the lowest point on the graph between your two index fingers. The probability that your thumb is more than 30 percent lower than your left index finger is 6.1 percent. This can be true even if your right index finger is higher than your left index finger. So why use this metric?
Why estimate now-to-trough?
I want to address a particular error I’ve seen a lot of people make. To quote a friend, “Stocks go up and down all the time, but if I leave it in there for 40 years, it’ll almost certainly be higher than it is now.” I actually agree with that statement, but it does not imply that you can’t get higher returns by temporarily selling your stocks (or shorting the market). If you knew with certainty that the market would drop 50 percent within the next month, you’d be a fool if you didn’t sell all your stocks now and then rebuy stocks closer to the bottom of the crash. The fact that we have to assign probabilities to crashes, rather than give guarantees, does not change anything of substance—it just adds extra steps in the maths. Suppose there’s only a 10 percent chance of the market crashing 30 percent tomorrow and a 90 percent chance of it going up 3 percent, then it would still be prudent to put your money into cash even though it’s a low probability event: Given those odds, it would be negative expected value to keep your wealth in stocks at that point, so there is no profitable Kelly bet.
The fact that the stocks will ultimately be higher does not mean that the people who sell now are making a mistake: There are mechanistic reasons why markets crash even if it’s guaranteed that the S&P 500 will be higher in 40 years than it is now (which I think it basically is). However, if we are going to try to “time the market”, we need to estimate a probability distribution for the highest peak and another for the lowest lows. If we sell too early, we lose. If we think the market will drop lower than it actually does, we’ll be waiting for a time that never comes. It is incredibly hard to correctly time the market, which is why investors who attempt it typically underperform the market in the long run. I’d generally recommend always having long positions, even when you think a crash is likely and that those stocks will fall in a market crash. This is to decrease your maximum drawdown if you’ve bet too early on a bubble. Then keep increasing the size of your short positions as the market rises (without an underlying reason for higher valueations, and decrease the short as the market drops.
Are we in the 6.1 percent?
Assuming these odds of now-to-trough drops of over 30 percent haven’t changed too much, the question then is “How much more likely is it that we are in that 6.1 percent today?”
The S&P’s CAPE ratio and PS ratio
The cyclically-adjusted price-earnings (CAPE) ratio of the S&P 500 is over double its historical average, and it’s a metric designed to evaluate when the stock market is overvalued. The only time the CAPE ratio has ever been higher is the lead up to the Dot Com crash. Right now, the CAPE is higher than it was at the market peak before the 1929 crash that led to the Great Depression. If the market does fall, and if this metric is reliable, the market has a long way to go down.
If you run a regression on the CAPE ratio to either the average now-to-peak or now-to-trough, you see a negative relationship at all timescales. I.e., as the CAPE increases, your expected upside is lower and your expected downside is greater, whatever your investment time horizon is. In my rough model, when the CAPE is below 33, peaks exceed troughs at all timescales. At 34, troughs are bigger only on a timescale of 1 to 5 months, but at all other times, the peaks are bigger. At a CAPE of 36.6, the 12-month trough finally exceeds the 12-month peak, with 6 months being the biggest gap. In July, the actual CAPE was around 38.
The price-to-sales ratio (PS ratio) of the S&P500 tells a similar story, being at more than double its median value since Jan 2001. Looking at data that goes back to 1993, this is the highest the PS ratio has ever been. The ratio is 38 percent higher than what it was before the Dot Com Crash.
Note that there could be reasons why the CAPE and PS ratios might not return to their historical average, e.g. increased savings chasing investments, which are not perfectly elastic. There may be risk of persistent inflation, which stocks hedge against. But I don’t think anything that’s happened justifies a CAPE of 38 when its average is 17, except perhaps perpetually low interest rates, and there’s some bad news on that front.
US inflation is high and interest rates are very low
At the time of writing, annualized month-to-month US inflation has been over double the long-run target which, if it persists, will force the Fed to take actions that increase interest rates earlier than their 2023 forecast. Higher than normal inflation is something that the Fed predicted, but inflation went beyond the Fed’s predictions, being higher and more persistent. The Fed is arguing that this inflation is transitory. What they do not have, however, is good justification for why they think all the extra inflation is transitory, which was pointed out by former U.S. Treasury Secretary Larry Summers.
Even if inflation “should” be transitory, people’s mere expectation of higher inflation can cause higher inflation: A shop that expects the money it receives to be worth less will raise its prices, and if all shops do so, then the money is indeed worth less. Because inflation is heavily influenced by expectation, it’s hard to predict with precision. The labour market is also going to create inflationary pressure. Wage growth is at a recent high, which can cause inflation: More dollars are competing for the same goods.
In order to reduce inflation, interest rates usually have to increase.
As I’ve been writing this, the Fed has brought forward its reduction in asset purchases, while also stating that it will not increase the interest rate earlier than intended. However, when the Fed reduces its purchases of bonds, they move the demand curve for all bonds to the left, which decreases the price of the bonds, which raises effective interest rates for everyone except the banks.
Interest rates significantly affect asset prices. Unexpected increases in the interest rate increase the discount rate that investors use in their (explicit or implicit) net present value calculations, which decreases the true value of stocks. Rational investors will sell until the trading price reaches that new true value.
The federal debt-to-GDP ratio is very high
When the Fed buys assets, it is adding to the demand side, meaning higher prices and lower interst rates. The Fed is now reducing asset purchases. When they raise interest rates on the US’s enormous debt, the US is more likely to default, which would likely cause a huge decrease in the S&P 500 index. A mere increase in the likelihood of default should cause a decrease in the index.
Margin debt to GDP ratio is at an all-time high
The total money that is in margin loans is at both an absolute all-time high, and a relative all-time high compared to GDP. Right before the Dot Com crash, the margin-debt-to-GDP ratio peaked at 3 percent. Right before the 2008 crash, the ratio peaked just below 3 percent. Today, the ratio is at 3.9 percent. This is the highest it has ever been. Before each of these three major crashes, the ratio rose rapidly over the course of a few months, rising 52% before 2000 and 60% in 2007. From the bottom of the Covid crash, the rise has been 77%.
However, increasing levels of automation in the financial markets causes me to expect higher margin-debt-to-GDP ratios in correctly valued markets. One reason for this is that when a computer program finds arbitrage, it can, theoretically, leverage infinitely with zero risk. Fewer companies were doing this in the early 2000s. Another reason may be that more investors are better maximizing long-run growth. To misuse a term (but get the idea across), they’re “Kelly betting”, which would require increasing leverage when the S&P 500 is undervalued, and decreasing leverage when the S&P 500 is overvalued. We can actually see that the troughs of the margin-debt-to-GDP ratio has gotten higher each time (though, this is not strong evidence, as there are only four datapoints). The ratio hasn’t been below 2% since late 2012. And will you look at that, I just had a quick look, and from 1960 to 1995, the ratio never went above 1%.
China’s housing bubble
China’s housing bubble is truly enormous. The China narrative I’ve heard for most of my life is that it will overtake the US and become the world’s dominant country. I strongly disagree with this claim. Government systems and culture are hard to quantitatively evaluate, but I also think they’re probably the most important drivers of long-run economic growth. Good systems, in any domain (not just government), ultimately have some robust logical justification. In the case of public policy and market rules, each good system provably satisfies some optimality criteria (free markets, for instance, satisfy Pareto efficiency). For the CCP to declare themselves as “Communist” means they are likely to disregard much granularity that good policy must have (the same can be said of policy makers who cheerlead Capitalism, who have privatised things in such a way that the incentives of the new system produce incredibly poor results, such as the US prison system).
When you have a government that identifies as Communist, that’s a threat that needs to be taken seriously. The evidence I’ve looked at this threat to evaluate this threat is anecdotal, which is often wrongly criticised. Certain anecdotes have much stronger weight than other anecdotes, which is often not considered by people who don’t understand Bayesian reasoning. Anecdotes are data, and data should update beliefs by an amount that’s subject to the strength in your belief of your priors, and the likelihood of the data occurring under the hypothesis you’re updating relative to the likelihood of the data occurring under all other hypotheses. Some anecdotes are incredbly strong evidence.
In this case, my anecdotal evidence is from Winston Sterzel and Matthew Tye, two Westerners who both lived in China for over a decade, both married Chinese women, and both had to escape China with their families under the threat of arrest under false charges of spying. (One of their Canadian friends was arrested, and subsequently released hours after Canada released an executive of Huawei who was legitimately arrested.) They have both experienced China’s extreme housing bubble. They’ve talked about
In early July, I told a friend that buying housing in China was like investing in a banana that you’re not going to eat. The investing, cultural, and political environments that these two people describe makes me very worried for the people of China, and we’ve seen before that large housing bubbles can take down the world economy. (I was not aware of any of particular housing businesses, such as Evergrande, when I wrote this.)
Conclusion
There are a lot of triggers for a potential sharp short-term drop in the S&P 500 index. Every major leading indicator is flashing red, which tells me the chance of a drop over 30 percent is much more likely than it normally is. Either forced sell offs (due to margin calls) or sell offs due to fear could cause a massive and rapid selling cascade. At the time of posting, the S&P 500 is 1.4 percent higher than when I made my prediction. I still claim there is a 65 percent chance that drop to 3029 will occur sometime before July 16, 2022.