Individual MMMLU tasks are extremely noisy. They’re so noisy that the paper actually specifically recommends that you don’t draw conclusions from performance on individual tasks and instead look at four high level topical categories. The individual tasks also have extremely large variances in their variance. Some of them are pretty easy for a college educated adult, while others have genuine experts scoring less than 80%.
This is compounded by the fact that the sample sizes vary wildly. While many of the tasks have around 100 questions, while at the other extreme there is a task with 1534 questions. The aggregated topics however have the same number of questions per topic, because the task was explicitly designed for analysis along those lines.
I don’t know the extent to which these issues plague the other evaluations, but I think more care needs to be taken before drawing conclusions with highly noisy data.
See my response to Gwern: https://www.lesswrong.com/posts/G993PFTwqqdQv4eTg/is-ai-progress-impossible-to-predict?commentId=MhnGnBvJjgJ5vi5Mb
In particular, extremely noisy data does not explain the results here, unless I've totally missed something. If the data is super noisy, the correlation should be negative, not zero, due to regression-to-mean effects (as indeed we saw for the smallest Gopher models, which are presumably so tiny that performance is essentially random).
Doesn't that mean that you are getting some predictiveness by looking at momentum? If progress on a task was totally unpredictable, with no signal and all noise, then your way of carving up the data would produce negative correlations. Instead you're mostly finding correlations near zero, or slightly positive, which means that there is just about enough signal to counteract that noise.
The signal to noise ratio is going to depend on a lot of contingent factors. There will be more noise if there are fewer questions on a task. There will be less signal from one model version to the next if there is a smaller increase in model size, or if the task is one where improvement happens very gradually as models scale up (though in those cases you could find a clearer signal by looking across several model versions, rather than just two consecutive jumps).
We should expect regression towards the mean only if the tasks were selected for having high "improvement from small to Gopher-7". Were they?
The two small models are not really significantly different from each other (p=0.04).
This means the tasks at hand are too hard for both small models, so neither of them can learn them really well, so the noise ends up being larger than the slope.
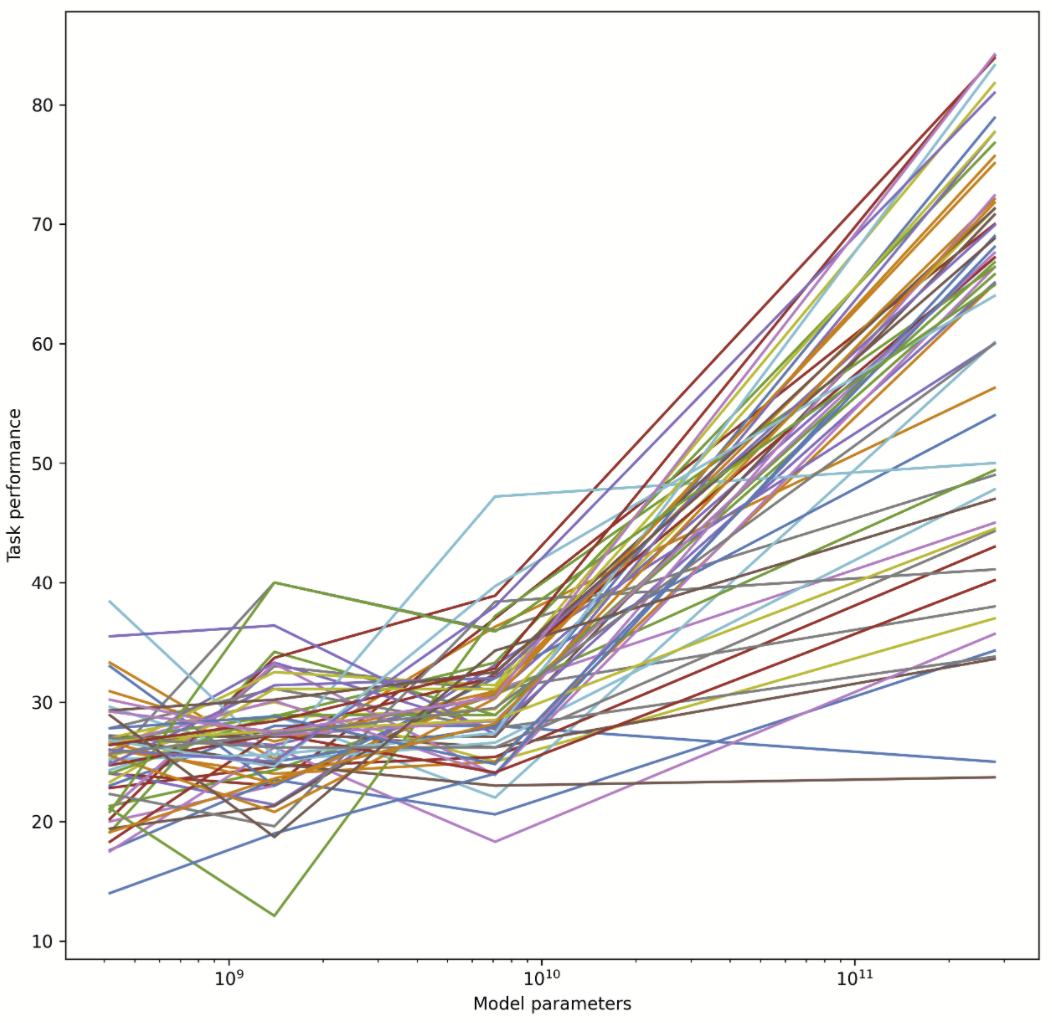
As others have noted, we are looking at sort of sigmoidal curves, and a different one for each task. Performance will plateau once it approaches the lowest possible error rate (Bayes error rate or limit of the model paradigm). It is known that performance often sharply increases with model size at some point (once the circuit complexity of the network is large enough to compute the task at all), but these sharp increases are not visible below as the x-axis is too coarse. Most tasks appear to have this point somewhere between 10B and 100B, but perhaps some of these tasks have more of a gradual increase in performance (can't tell due to coarseness). The task that appears to have already plateaued was possibly an outlier for the 7.1B model, but perhaps it also has a huge Bayes error or is simply not better learnable with these kinds of models.
Yeah, I don't find a linear regression on pairs of models to be all that informative:
-
the parameterization as % is misleading, squashing differences
- especially as you would expect for 2 reasons performance to spend most of its time near 0 or 1: near 1, because we are so excited about DL because it is solving so many tasks, and once solved they stay solved; and near 0 because, so many of the tasks now approaching 1, we need to create even more super-duper hard, now usually adversarially constructed, tasks, where all the models start off around 0
- it also would tend to exaggerate or erase the plateaus and phase transitions based on where the model sizes start in the transition and what the base rate of error is, neither of which has any principled connection to the phenomenon of interest (it is not important if the baseline is 10% error because it's a multiple-choice with 10 options instead of 25% because it had 4 options).
-
individual tasks have a lot of random sampling error: ie. if we constructed it a second time with fresh data, we would see the same models get different scores
-
individual models have 'sampling error': each model is a sample from the Bayesian posterior and will make somewhat different predictions; this will lead to different scores on the same task (ie. if we trained the same model in exactly the same way except for the random seed & other nondeterminism like GPU ops/network, it would get different scores on the same task)
-
comparing a single pair of models is not very powerful:
- You don't have 'n = 62', you have 'n = 1'. (Imagine if you broke down each task into its individual single-questions instead of the fairly arbitrary existing task chunks. Do you now suddenly have n=100,000 or whatever? No, of course not.)
- range restriction in model scaling: these are power/log phenomenon; pair of models differing by a single order of magnitude is not informative.
Plotting the predictive loss over many models and multiple orders of magnitude is meaningful. Plotting it versus normalized performance across many tasks is also reasonable albeit highly noisy. Plotting individual tasks of single checkpoints against somewhat larger checkpoints is a recipe for baking in so much noise at so many levels, deflating everything by measurement error so far towards zero, that I'm not too surprised one doesn't see any clear patterns in the residuals and may be chasing noise.
I re-ran the Gopher MMLU and Big-Bench data as logits rather than raw percentages, the correlation is still zero:
https://i.imgur.com/mSeJoZM.png
(Logit performances for the 400M model and 7B model were highly significantly different, p = 6*10^-7 in single factor ANOVA.)
In the case of MMLU, because random performance is 25% rather than 0%, I tried subtracting 14% (the lowest score of any model on any task) before running the logit, to try to reduce noise from floor effects; the correlation was still zero. The highest score of any model on any task was 96%, few were above 90% and averages were in the 25%-75% range, so I don't think ceiling effects are currently significant here.
If the performance of any given model on any given task were super noisy, you should expect negative correlation, not zero, because of reversion-to-mean effects. Eg., here is a simulation I ran with n = 60 simulated tasks, with different values for the ratio between "how much variance is there in task scalability?" and "how much noise is there for the performance of a given model on a given task?":
https://i.imgur.com/1I71IO0.png
If there is a lot of noise, the correlation is negative; it's pretty unusual to get exactly zero. (Code: https://gist.github.com/rationalism/b8925017700605b339b8f8439283d670)
The way questions are chunked is pretty non-arbitrary, in that questions within a task are much more similar to each other than random questions? Eg., here are two questions from one random BIG-bench task and two from a second task:
"input": "Each time you play your guitar, you are playing an instrument.",
"target_scores": { "causal": 0, "correlative": 0, "neutral": 1 }
"input": "Looking into a bright light makes my eyes water.",
"target_scores": { "causal": 1, "correlative": 0, "neutral": 0 }
Q: (1 + 1 + 1 + 1) =
A: 4
Q: ((2 * 2) + (3 * 1)) =
A: 7
If the performance of any given model on any given task were super noisy, you should expect negative correlation, not zero, because of reversion-to-mean effects.
Which you see comparing the two smaller model's improvements to each other, no?
I don't expect reversion to the mean to be clearly dominant wrt. 7.1→280B because the effect is much smaller than the capability jump there. It's also worth remembering that these smaller model outputs can be arbitrary but not necessarily random; I wouldn't expect one 1000M parameter model's outputs to be fully decorrelated with another 1000M parameter model's outputs even if performance was pure chance.
The PaLM NLU/BigBench numbers do seem to be positively correlated, in contrast, especially when using logits or looking at error rate, as is more reasonable of them given the nonzero performance.
E: Did I say something dumb? I cannot figure out why I've been singularly downvoted here. AFAICT the things I am saying are primarily factual.
Interesting analysis. Have you tried doing an analysis on quantities other than % improvement? A 10% improvement from low accuracy is different from a 10% improvement at high accuracy. So for example, you could try doing a linear regression from small_to_medium_improvement, medium_accuracy -> large_accuracy and look at the variance explained.
Edit: I tried linear regression on the chinchilla MMLU data, predicting the large model accuracy from the 3 smaller models' accuracies, and only got 8% of variance explained, vs 7% of variance explained by only looking at the second largest model's accuracy. So that's consistent with the OP's claim of unpredictability.
Edit2: MMLU performance for the smaller models is about chance level, so it's not surprising that we can't predict much from it. (The accuracies we're looking at for these models are noise.)
Good to ask, but I'm not sure what it would be. The code is just a linear regression I did in a spreadsheet, and eyeballing the data points, it doesn't look like there are any patterns that a regression is missing. I tried it several different ways (comparing to different smaller models, comparing to averages of smaller models, excluding extreme values, etc.) and the correlation was always zero. Here's the raw data:
https://docs.google.com/spreadsheets/d/1Y_00UcsYZeOwRuwXWD5_nQWAJp4A0aNoySW0EOhnp0Y/edit?usp=sharing
It's hard to know if there is some critical bug in all the results being reported in the Gopher, Chinchilla, and PaLM papers, since we don't have access to the models, but it would surprise me if no one caught that across multiple independent teams.
I. FRAMING A RESPONSE CONCEPTUALLY
A starting assumption of mine is that a bigger and bigger model will not get better and better at tictactoe.
The task is fundamentally finite, and also, in this case, it is a simple task that will be saturated quickly and this is obvious by inspection.
This is just a generic supposition but it is a useful "bounded & easy" example that fits in a clear place in a 2x2 concept grid that has {bounded, infinite} X {easy, hard}.
So I'm pretty sure at least some "infinite & hard" versions exist. (However, also, humans are barely capable of doing this kind of stuff autonomously.)
Proof sketch based on Godel:
We know from "the incompleteness theorem" that second order predicate logic is "infinite" in some sense, because for all non-trivial sets of axioms you can find propositions in the implied logical universe that could be EITHER of true or false... and then the mathematician gets to pick which they like better, and either can be productively explored, and the mathematician will never get "stuck" with a system that contains no interesting propositions after making a choice.
(For example, Euclid's first four postulates define a game that leaves "parallel line" questions undecidable... and then mathematicians can, once they notice this choice, pick (using a fifth postulate) if they want to play in a playground that is: spherical, planar, or hyperbolic ...and they can keep doing that "notice choice, make choice" thing forever.
(Maybe it won't always be "aesthetically interesting" though? I don't currently know how to formalize mathematical aesthetics and prove things with the formalization of formalization. This is not needed for the more practical result however.))
So "infinite & hard" tasks are conceivable (though they might be pragmatically useless eventually, like how most people probably think of hyperbolic geometry as useless).
II. ORIENTING TO THIS DATA
It took me a while to orient to your data because the title led me to assume that each bigger model just got lower objective loss on its training data as the models got bigger, and...
...that's the end of that, and it has potentially pretty obvious trajectories I'd think?
...but after orienting I didn't find that much of the data to be that surprising, because it looks like the bulk of what's being measured here are a bunch of finite shards of human linguistic performance?!?
This isn't "AI progress" then, so much as "domain specific linguistic reasoning progress"... I think?
And... my assumption is that domain knowledge will mostly always be BOUNDED.
But the EASY/HARD part will potentially vary a lot from task to task?
The causal model here leads one to think about a generative model of AI language tasks difficulty would involve modeling human engineers and scientists doing human stuff, and it won't necessarily work sanely, especially if they do not currently (or have not in the past) really taken AGI seriously, and are not trying to design tasks that measure an approach to this outcome as the core thing to be interested in. Since many normal researchers have not been taking seriously for a very very long time, why would they do particularly any better now?
Backing out from the details about the people making the tasks... the obvious default here is that, for any given finite task, you would expect that performance on that task, scaled to resources/effort, will scale according to a logistic curve.
Indeed, the wikipedia article uses TASK PERFORMANCE SATURATION as its core example, for how "the concept of logistic regression" can be pragmatically approached.
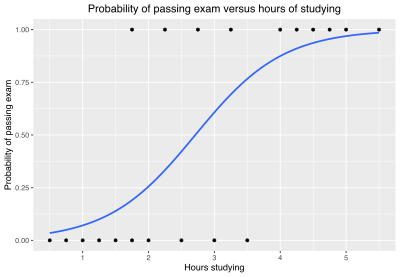
So the thing I'd be looking for, naively, is any task specific curve that looks like this!
Assuming the prior is correct, non-naively, we seek falsification and look for things that COULD NOT be this!
III. APPLYING THE LOGISTIC CURVE FRAME TO THE DATA (TAKE 1)
I did find some in the raw data that was linked to.
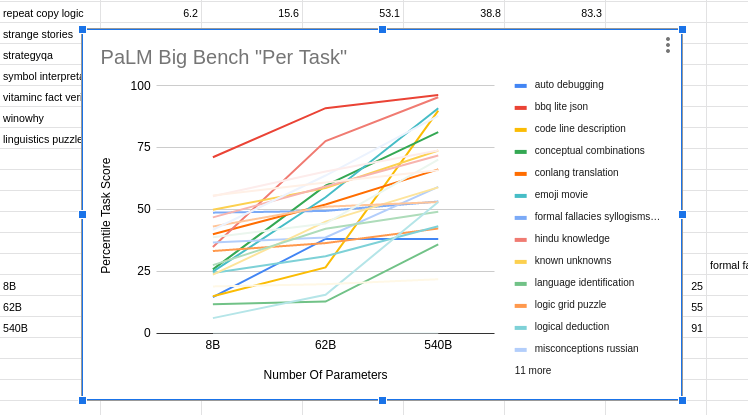
The only dramatically obvious violation to my logistic regression prior is the dark blue one at the bottom (maybe "auto debugging"), which JUMPS UP from 8B Soto 62B but then seems to ALREADY SATURATE WELL BELOW 100% (and then actually goes slightly down on the 540B parameter model).
That specific task is a counter-example to what I expect.
That's where "I notice I'm confused" should kick in.
The thing I would do next, based on the strength of my priors, is treat that as a faulty task, and debug the task itself to make sure it wasn't two thirds full of "cheating questions" somehow.
A sane reasoner, presented with questions that are cheating, would eventually "notice the cheating" and "just guess" on those questions. In this case, by hypothesis, 1/3 of the "auto debugging" task questions are solvable, and the other 2/3s would be "password guessing" that are impossible to get right from coherent reasoning over a coherent body of accessible domain knowledge (such as was in the training data (like maybe the training data doesn't have much in it from car mechanics and car designers and maybe it doesn't have any transcripts from cartalk?)).
But I might be wrong. Maybe that task is NOT broken-via-bimodal-question-difficulty into "easy" and "impossible" questions?
Or maybe the sampling-over-model-sizes is too sparse to definitely rule in or out the logistic regression prior with no violations?
Or maybe my whole conceptual frame is broken?
But I don't think my concepts are missapplied here, and maybe it isn't just undersampling on the model size dimension... my max-liklihood hunch is that that task is "weird somehow".
Compared to that potential anomaly, every other task in this graph, by eyeball, looks consistent with having been sampled from a horizontal range of a logistic regression curve that ultimately asymptotes at 100%, with a linear-ish progress curve in the middle, and a starting state of "blind confusion and not even making much progress for a while in the lower left".
At the top, the red line makes it look like "bbq lite json" was already saturating with a mere 8B parameters, which is consistent with the asymptotic part of a logistic curve.
The strongly yellow-orange line of "code line description" looks like it was caught during the exponential takeoff. Also consistent.
A lot of them (like maybe that teal one that might be "emoji movie" that ends close to the top?) look basically linear in the observed range. The linear part, suggests that the "low progress confusion period" would only be visible off to the left and would take a small model to see, like one with only 1B parameters or 30M parameters.
Also the linear teal line has not looking saturated yet at the top left, and so it might be necessary to might need to do a 5T parameter model to see the logistic curve smooth out towards an asymptote of 100% performance?
That's the claim anyway.
III. APPLYING THE LOGISTIC CURVE FRAME TO THE DATA (TAKE 2)
Looking at a different family of tasks and a different model's scaling performance...
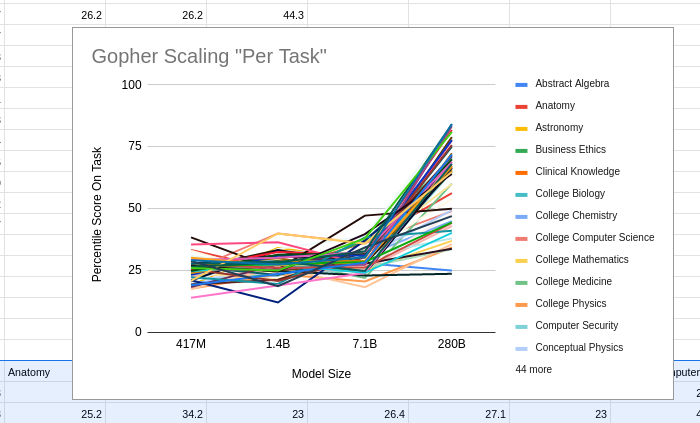
Gopher looks to me, for these tasks, like it was thrashing around in "low level confusion" for ALL of the tasks, and then it started climbing on many of them in the last iteration with 280B parameters, but it hasn't saturated yet on ANY of the tasks, and would take a big bump (like maybe another 2 trillion, 30 trillion, or 200 trillion parameters?) to show the mastery/saturation start to occur for those tasks as well.
IV. A TANGENT INTO PSYCHOMETRICS
If there is any "I noticed I'm confused" aspect of this overall data, it would be that maybe the confused thrashing around should be happening closer to like 5% performance, instead of around 25% performance?
But you could maybe explain this by normal/correct psychometric test design principles, tilted towards modern academic culture which treats "half the class gets 50% of the questions right" as a social tragedy?
In a "clean" psychometric design (that doesn't worry about student hedonics), the goal is to SEPARATE the students based on differences in the students, and so you want a lot of binary questions close to "50% difficulty for these students".
But then worse students will fail on nearly all of these so you give them some questions that have "a 50/50 chance of help separate mastery of 10% of the content from 20% of the content" which are "wasted gimme questions" for the smarter students.
And then for better students, they will max ALL of these questions, and so if you actually want your A- to be meaningfully different from your A+ you need to have some questions that "a 50/50 chance of separating the students that mastered 92% of the content from 98% of the content".
Maybe all these Gopher tasks have "~25% gimme questions for the slow students" and not "5% gimme questions for the slow students"?
Oh! Insight after re-reading all of the above!
Probably what's happening is that there are multiple choice answers, with 4 options, and so 25% performance is overall the worst it can do by random guessing.
So maybe that's where the low end logistic curve thrashing is? <3
V. CONCLUSIONS AND DISCUSSION (technical... then deontic)
I didn't look closely at the other data sets for the other big models that have varying sizes.
Partly I wanted to save some data as "holdout" to check my reasoning against.
Maybe some of those models somehow falsify my high level "logistic regression over finite tasks is the right frame" prior?
BUT ALSO, the things I have written above (assuming they are correct) might help people understand the results of these big language models better, and design better tasks, and plan how to use their piles of money more efficiently to build smaller and better models that can do predictable tasks for predictable amounts of money.
IF you can calibrate the AI tasks (just like human-student performance tests that are good or bad as a psychometric measurement of domain mastery, with a logistic prior for all such tasks...
...THEN I think that would help plan capital expenditures for big model training runs more predictably?
But it isn't clear to me that such an outcome would be good?
I have been personally trying to not to make the march towards AGI go any farther or faster due to my own efforts...
...and this comment here is a VIOLATION of such a principle.
However, maybe I should stop caring so much. Assuming short timelines, large scale impacts on discourse might not matter so much any more?
I had another ~2500 words beyond this where I tried to do an equivalent amounts of reasoning that felt like maybe it could "make up" for the harm potentially done here, but I then figured I can always publish those words later (possibly with more polishing and better impacts) if it still makes sense to publish the rest later.
In the meantime... yeah, this data does not naively "look weird" to me or particularly "unpredictable"?
It just looks like (1) a pile of logistic regression curves for (2) different tasks with varying logistic curve parameters for different tasks... plus... (3) sparse sampling on the "effort" X-axis?
See my response to Gwern: https://www.lesswrong.com/posts/G993PFTwqqdQv4eTg/is-ai-progress-impossible-to-predict?commentId=MhnGnBvJjgJ5vi5Mb
Sorry, I'm not sure I understood everything here; but if the issue were that task performance "saturated" around 100% and then couldn't improve anymore, we should get different results when we graph logit(performance) instead of raw performance. I didn't see that anywhere.
tl;dr: if models unpredictably undergo rapid logistic improvement, we should expect zero correlation in aggregate.
If models unpredictably undergo SLOW logistic improvement, we should expect positive correlation. This also means getting more fine-grained data should give different correlations.
To condense and steelman the original comment slightly:
Imagine that learning curves all look like logistic curves. The following points are unpredictable:
- How big of a model is necessary to enter the upward slope.
- How big of a model is necessary to reach the plateau.
- How good of performance the plateau gives.
Would this result in zero correlation between model jumps?
So each model is in one of the following states:
- floundering randomly
- learning fast
- at performance plateau
Then the possible transitions (small -> 7B -> 280B) are:
1->1->1 : slight negative correlation due to regression to the mean
1->1->2: zero correlation since first change is random, second is always positive
1->1->3: zero correlation as above
1->2->2: positive correlation as the model is improving during both transitions
1->2->3: positive correlation as the model improves during both transitions
1->3->3: zero correlation, as the model is improving in the first transition and random in the second
2->2->2: positive correlation
2->2->3: positive correlation
2->3->3: zero correlation
3->3->3: slight negative correlation due to regression to the mean
That's two cases of slight negative correlation, four cases of zero correlation, and four cases of positive correlation.
However positive correlation only happens if the middle state is state 2, so only if the 7B model does meaningfully better than the small model, AND is not already saturated.
If the logistic jump is slow (takes >3 OOM) AND we are able to reach it with the 7B model for many tasks, then we would expect to see positive correlation.
However if we assume that
- Size of model necessary to enter the upward slope is unpredictable
- Size of a model able to saturate performance is rarely >100x models that start to learn
- The saturated performance level is unpredictable
Then we will rarely see a 2->2 transition, which means the actual possibilities are:
Two cases of slight negative correlation
Four cases of zero correlation
One case of positive correlation (1->2->3, which should be less common as it requires 'hitting the target' of state 2)
Which should average out to around zero or very small positive correlation, as observed.
However, more precise data with smaller model size differences would be able to find patterns much more effectively, as you could establish which of the transition cases you were in.
However again, this model still leaves progress basically "unpredictable" if you aren't actively involved in the model production, since if you only see the public updates you don't have the more precise data that could find the correlations.
This seems like evidence for 'fast takeoff' style arguments--since we observe zero correlation, if the logistic form holds, that suggests that ability to do a task at all is very near in cost to ability to do a task as well as possible.
I think I endorse this condensation/steelman! Thank you for making it :-)
For more in this vein maybe: why forecasting S-curves is hard. The associated video is pretty great.
I just got it from the papers and ran a linear regression, using pdftables.com to convert from PDF to Excel. I used pages 68 and 79 in the Gopher paper:
https://arxiv.org/pdf/2112.11446.pdf
Page 35 in the Chinchilla paper:
https://arxiv.org/pdf/2203.15556.pdf
Pages 79 and 80 in the PaLM paper:
OK, here's a Google sheet I just threw together: https://docs.google.com/spreadsheets/d/1Y_00UcsYZeOwRuwXWD5_nQWAJp4A0aNoySW0EOhnp0Y/edit?usp=sharing
Thanks! At least for Gopher, if you look at correlations between reductions in log-error (which I think is the scaling laws literature suggests would be the more natural framing) you find a more tighter relationship, particularly when looking at the relatively smaller models.
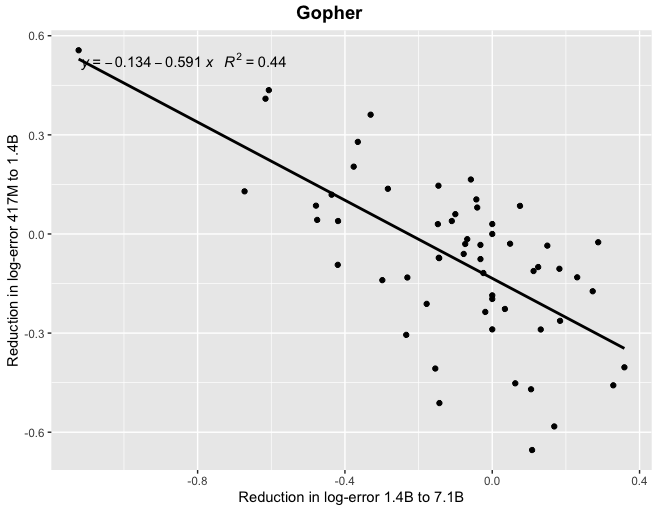
Thanks! Is the important thing there log-error, though, or just that if the absolute performance difference between models is small enough, then different task performance between the two is noise (as in parallel runs of the same model) and you do wind up reverting to the mean?
I can't get the image to display, but here's an example of how you get a negative correlation if your runs are random draws from the same Gaussian:
https://i.imgur.com/xhtIX8F.png
I'm not sure what you mean; I'm not looking at log-odds. Maybe the correlation is an artefact from noise being amplified in log-space (I'm not sure), but it's not obvious to me that this isn't the correct way to analyse the data.
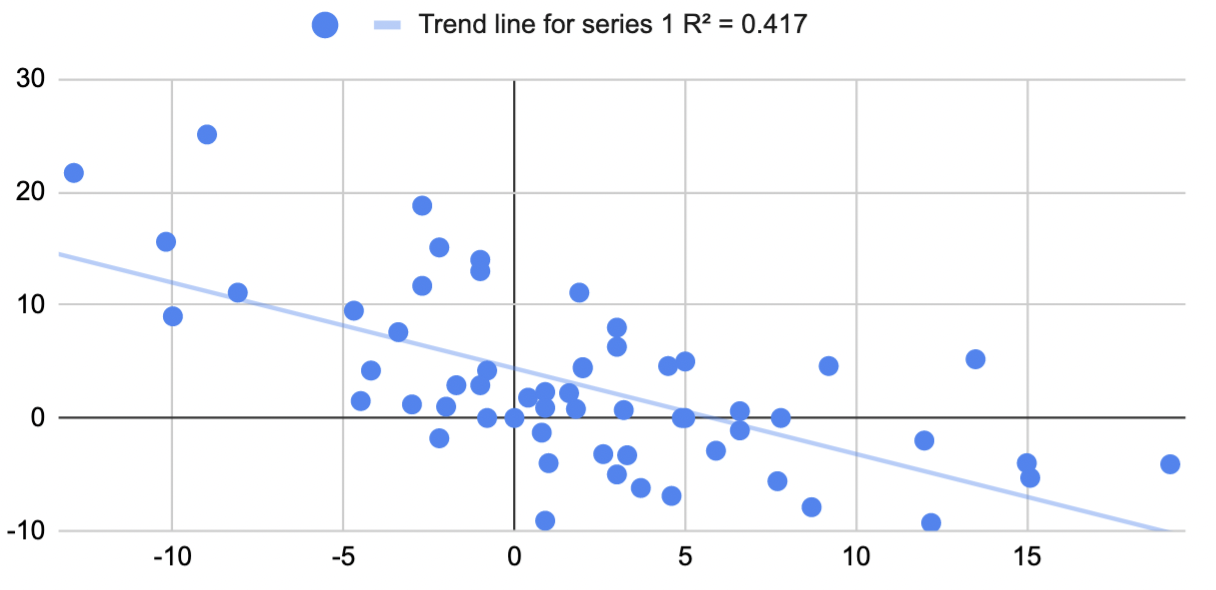
Here's the corresponding graph for the non-logged difference, which also displays a large correlation.
Nitpick: wouldn't this graph be much more natural with the x and y axes reversed? I'd want to input the reduction in log-error over a cheaper compute regime to predict the reduction in log-error over a more expensive one.
According to current understanding of scaling laws most tasks follow a sigmoid with their performance w.r.t. model size. As we increase model size, we have a slow start followed by a rapid improvement, followed by a slow saturation towards maximum performance. But each task has different shape based on its difficulty. Therefore in some tasks you might be in the rapid improvement phase when you do one comparison and then you might he in saturated phase when you do another. The results you are seeing are to be expected so far. I would visualize absolute performance for each task for a series of models to see how the performance actually behaves.
I started writing this but lost faith in it halfway through, and realized I was spending too much time on it for today. I figured it's probably a net positive to post this mess anyway although I have now updated to believe somewhat less in it than the first paragraph indicates. Also I recommend updating your expected payoff from reading the rest of this somewhat lower than it was before reading this sentence. Okay, here goes:
{I think people here might be attributing too much of the explanatory weight on noise. I don't have a strong argument for why the explanation definitely isn't noise, but here is a different potential explanation that seems promising to me. (There is a sense in which this explanation is still also saying that noise dominates over any relation between the two variables -- well, there is a formal sense in which that has to be the case since the correlation is small -- so if this formal thing is what you mean by "noise", I'm not really disagreeing with you here. In this case, interpret my comment as just trying to specify another sense in which the process might not be noisy at all.) This might be seen as an attempt to write down the "sigmoids spiking up in different parameter ranges" idea in a bit more detail.
First, note that if the performance on every task is a perfectly deterministic logistic function with midpoint x_0 and logistic growth rate k, i.e. there is "no noise", with k and x_0 being the same across tasks, then these correlations would be exactly 0. (Okay, we need to be adding an epsilon of noise here so that we are not dividing by zero when calculating the correlation, but let's just do that and ignore this point from now on.) Now as a slightly more complicated "noiseless" model, we might suppose that performance on each task is still given by a "deterministic" logistic function, but with the parameters k and x_0 being chosen at random according to some distribution. It would be cool to compute some integrals / program some sampling to check what correlation one gets when k and x_0 are both normally distributed with reasonable means and variances for this particular problem, with no noise beyond that.}
This is the point where I lost faith in this for now. I think there are parameter ranges for how k and x_0 are distributed where one gets a significant positive correlation and ranges where one gets a significant negative correlation in the % case. Negative correlations seem more likely for this particular problem. But more importantly, I no longer think I have a good explanation why this would be so close to 0. I think in logit space, the analysis (which I'm omitting here) becomes kind of easy to do by hand (essentially because the logit and logistic function are inverses), and the outcome I'm getting is that the correlation should be positive, if anything. Maybe it becomes negative if one assumes the logistic functions in our model are some other sigmoids instead, I'm not sure. It seems possible that the outcome would be sensitive to such details. One idea is that maybe if one assumes there is always eps of noise and bounds the sigmoid away from 1 by like 1%, it would change the verdict.
Anyway, the conclusion I was planning to reach here is that there is a plausible way in which all the underlying performance curves would be super nice, not noisy at all, but the correlations we are looking at would still be zero, and that I could also explain the negative correlations without noisy reversion to the mean (instead this being like a growth range somewhere decreasing the chance there is a growth range somewhere else) but the argument ended up being much less convincing than I anticipated. In general, I'm now thinking that most such simple models should have negative or positive correlation in the % case depending on the parameter range, and could be anything for logit. Maybe it's just that these correlations are swamped by noise after all. I'll think more about it.
If you look at the logit given a range that is not [0.0, 1.0] but [low perf, high perf], then you get a bit more predictive power, but it is still confusingly low.
A possible intuition here is that the scaling is producing a transition from non-zero performance to non-perfect performance. This seems right since the random baseline is not 0.0 and reaching perfect accuracy is impossible.
I tried this only with PaLM on NLU and I used the same adjusted range for all tasks:
[0.9 * overall min. acc., 1.0 - 0.9 * (1.0 - overall max acc.)] ~ [0.13, 0.95]
Even if this model was true, they are maybe other additional explanations like the improvement on one task are not modeled by one logit function but by several of them. A task would be composed of sub-tasks each modelizable by one logit function. And if this make sense, one could try to model the improvements in all of the tasks using only a small number of logit curves associated to each sub-tasks (decomposing each tasks into a set of sub-tasks with a simple trend).
(Also Gopher looks like less predictable and the data more sparse (no data point in the X0 B parameters))
These task performances tend to be bounded in 0% and 100%, right? What happens if you logit transform before predicting? I would assume that would improve prediction by a very large amount.
I tried converting the Gopher figures to logits, still got effectively zero correlation. I can't figure out how to embed an image here, but here's the link:
https://imgur.com/3tg397q
Curated. I quite appreciated both Alyssa's empirical work here, as well as the collaborative effort other commenters brought by digging into the data themselves and considering other ways of looking at it.
I wonder if there are any measurable dimensions along which tasks can vary, and whether that could help with predicting task progress at all. A simple example is the average input size for the benchmark.
Domain independence usually means the algorithm isn't tailored on how to use/process domain specific information, so just looking for general patterns in the data itself, hopefully leading to something meaningful. When we humans aren't taught certain subjects, the quality of our own inferences come from pattern matching based on our individual's observations, maybe certain algorithms that we are specifically taught in other domains may become applicable or somewhat useful in this new domain. Most of the deeper subjects we learn, we learn them through carefully curated instructions that grows with depth and complexity as we master the subject matter. This is similar to how we carefully tailor the algorithm to its specific domains.
For general learners, they are just jack of all trades master of none.
Isn't that just conflation of training data with fundamental program design? I'm no expert, but my impression is that you could train GPT-1 all you want and it would never become GPT-3.
you could train GPT-1 all you want and it would never become GPT-3
True. One algorithm is going to be different than another. The metrics you measure them on (e.g. precision recall) ultimately determines how you are going to use that algorithm. General learners can be modified to become domain specific, but usually narrowing your data down to specific domain and build an ensemble learner would give you better results. GPT parses on general string data, and then applies classification on them. When you become domain specific, you can usually find better algorithms, or different ways of processing the data that would give you better results.
The question is what do you want to learn from the data? For general learners, you can ask for all kinds of answers. General learners are designed to do different things than domain specific ML. My experience with GPT is that the interface is rather general, like you can ask for any kind of data.
These are multiple choice questions out of 4 and performance for model sizes ≤7.1B is ~zero, so sure, that's pretty natural, any variation between .4B and 7B is dominated by noise. You can just graph all of the curves to check this.
Noise is so high because there is a minimum competence bar in language understanding before you can start solving complex multi-step problems inside language, and the baseline probability of guessing correctly is significant.
See my reply to Gwern: https://www.lesswrong.com/posts/G993PFTwqqdQv4eTg/is-ai-progress-impossible-to-predict?commentId=MhnGnBvJjgJ5vi5Mb
People seem to be continually surprised, over and over again, by the new capabilities of big machine learning models, such as PaLM, DALL-E, Chinchilla, SayCan, Socratic Models, Flamingo, and Gato (all in the last two months!). Luckily, there is a famous paper on how AI progress is governed by scaling laws, where models predictably get better as they get larger. Could we forecast AI progress ahead of time by seeing how each task gets better with model size, draw out the curve, and calculate which size model is needed to reach human performance?
I tried this, and apparently the answer is no. In fact, whether AI has improved on a task recently gives us exactly zero predictive power for how much the next model will improve on the same task. The sheer consistency of this unpredictability is remarkable, almost like a law of statistical thermodynamics. No matter what I plug in, the correlation is always zero! For example, does a task improving rapidly when you go from a small model to a 7B parameter model predict similar improvement when you go from a 7B model to Gopher's 280B? No:
I tried making the same graph with MMLU tasks instead of BIG-bench, same result:
What about DeepMind's new Chinchilla? Did rapid improvement of a task on Gopher predict continued improvement going from Gopher to Chinchilla? Nope:
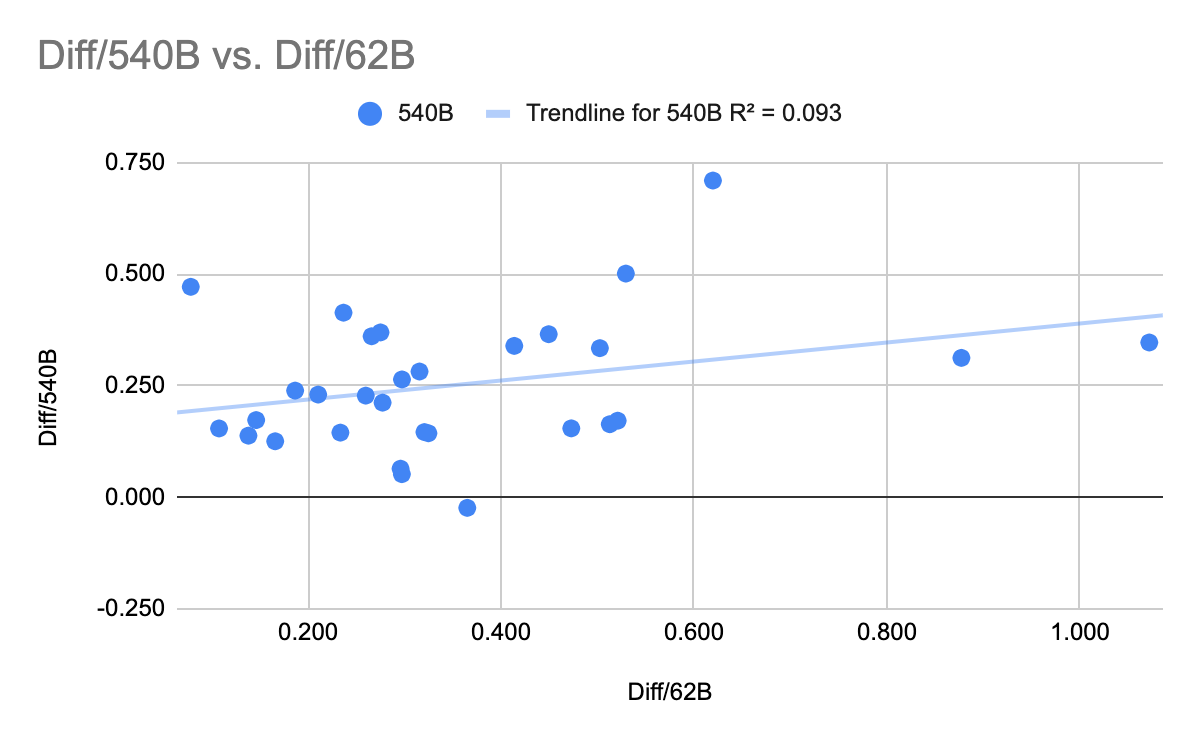
What about Google's PaLM? The full results of PaLM on BIG-bench don't seem to have been published yet, so I couldn't directly compare to Chinchilla or Gopher, but the PaLM paper described an 8B parameter model, a 62B model and a 540B model. Did fast improvement from 8B to 62B predict improvement from 62B to 540B? Not really, R^2 = 0.04:
PaLM also provides data on 30 different NLU benchmark tasks. Plot those and you get the same thing:
The results here seem pretty clear, but I'm honestly not sure how to interpret them. Before trying this, I assumed you would find that some tasks are "easy" and scale quickly, while others are "hard" and scale slowly. But that would get you high predictability, since fast progress between one pair of models would imply that the task is inherently "easy", and predict (perhaps with some noise) fast progress on the next pair. I didn't see that.
You could also have a theory where tasks scaled similarly (all are of comparable "difficulty"), but there was some noise between model training runs, so that task performance on any given run would bounce up and down around some "true" average value. (Since if you did badly on one run, you'd expect to regress to the mean, and do unusually well on the next.) But I didn't see that either. The two effects (some tasks being intrinsically easier, and individual model runs being noisy) could also cancel out, since one implies a positive correlation and the other implies a negative one... but it seems unlikely that they would exactly cancel every time!
Is AI task performance a type of submartingale, like a stock market index that goes up over time, but where each particular movement is intrinsically unpredictable? Maybe we can compare it to the growth in company profits, where the literature says that companies might grow slowly or quickly, but whether a company has grown fast recently has zero predictive power for future growth. I guess if we knew what we were doing, it wouldn't be called research.
EDIT: By request, here's a Google sheet with the raw data, copy-pasted from the Gopher, PaLM and Chinchilla papers: https://docs.google.com/spreadsheets/d/1Y_00UcsYZeOwRuwXWD5_nQWAJp4A0aNoySW0EOhnp0Y/edit?usp=sharing
EDIT 2: Several people suggested using logits instead of raw percentages. I tried that with the Gopher numbers, still got zero correlation:
EDIT 3: Tamay noted that if you try to predict 7B Gopher from 1B Gopher, you get a negative correlation:
If the models become small enough, maybe this means that scale isn't helping you at that level, so the differences between performances are noise and you should expect mean reversion? Eg., here is a graph of a negative correlation between different "runs", where the "runs" are just draws from a random Gaussian: