We rationalists are very good at making predictions, and the best of us, such as Scott Alexander
This weird self-congratulatory tribalism is a completely unnecessary distraction from an otherwise informative post. Are "we" unusually good at making predictions, compared to similarly informed and motivated people who haven't pledged fealty to our social group? How do you know?
Scott Alexander is a justly popular writer, and I've certainly benefitted from reading many of his posts, but it seems cultish and bizarre to put him on a pedestal as "the best" of "us" like this as the first sentence of a post that has nothing to do with him.
changed to "Making predictions is a good practice, writing them down is even better."
does anyone have a better way of introducing this post?
Overall great post: by retrospectively evaluating your prior predictions (documented so as to avoid one's tendency to 'nudge' your memories based on actual events which transpired) using a 'two valued' Normal distribution (guess and 'distance' from guess as confidence interval), rather than a 'single-valued' bernoulli/binary distribution (yes/no on guess-actual over/under), one is able to glean more information and therefore more efficiently improve future predictions.
That opening statement, while good and useful, does come off a little 'non sequitur'-ish. I urge to find a more impactful opening statement (but don't ahve a recommendation, other than some simplification resulting from what I said above).
My original opening statement got trashed for being to self congratulatory, so the current one is a hot fix :), So I agree with you!
(Edit: the above post has 10 up votes, so many people feel like that, so I will change the intro)
You have two critiques:
-
Scott Alexander evokes tribalism
-
We predict more than people outside our group holding everything else constant
-
I was not aware of it, and I will change if more than 40% agree
Remove reference to Scott Alexander from the intro: [poll]{Agree}{Disagree}
- I think this is true, but have no hard facts, more importantly you think I am wrong, or if this also evokes tribalism it should likewise be removed...
Also Remove "We rationalists are very good at making predictions" from the intro: [poll]{Agree}{Disagree}
If i remove both then I need a new intro :D
I think you're advocating two things here:
- Make a continuous forecast when forecasting a continuous variable
- Use a normal distribution to approximate your continuous forecast
I think that 1. is an excellent tip in general for modelling. Here is Andrew Gelman making the same point
However, I don't think it's actually always good advice when eliciting forecasts. For example, fairly often people ask whether or not they should make a question on Metaculus continuous or binary. Almost always my answer is "make it binary". Binary questions get considerable more interest and are much easier to reason about. The additional value of having a more general estimate is almost always offset by:
- Fewer predictors => less valuable forecast
- People update less frequently => Stale forecast
- Harder to visualize changes over time => Less engagement from the general public
I think your point 2. has been well dealt with by gbear605, but let me add my voice to his. Normal approximations are probably especially bad for lots of things we forecast. Metaculus uses a logistic distribution by default because it automatically includes slightly heavier tails than normal distributions.
Agreed 100% on 1) and with 2) I think my point is "start using the normal predictions as a gate way drug to over dispersed and model based predictions"
I stole the idea from Gelman and simplified it for the general community, I am mostly trying to raise the sanity waterline by spreading the gospel of predicting on the scale of the observed data. All your critiques of normal forecasts are spot on.
Ideally everybody would use mixtures of over-dispersed distributions or models when making predictions to capture all sources of uncertainty
It is my hope that by educating people in continuous prediction the Metaculus trade off you mention will slowly start to favor the continuous predictions because people find it as easy as binary prediction... but this is probably a pipe dream, so I take your point
Foretold (https://www.foretold.io/) supports many continuous functions including normal for predictions and resolutions. It also had scoring rules for continuous predictions and resolution functions, and composite functions for both. The creator, Ozzie Gooen, was working on an even more sophisticated system but I'm not sure what stage that's currently at.
The more sophisticated system is Squiggle. It's basically a prototype. I haven't updated it since the posts I made about it last year.
https://www.lesswrong.com/posts/i5BWqSzuLbpTSoTc4/squiggle-an-overview
I generally agree with the idea - a range prediction is much better than a binary prediction - but a normal prediction is not necessarily the best. It’s simple and easy to calculate, which is great, but it doesn’t account for edge cases.
Suppose you made the prediction about Biden a couple months before the election, and then he died. If he had been taken off of the ballot, he would have received zero votes, and even if he had been left on “Biden” would have received much fewer votes. Under your normal model, the chance of either of those happening is essentially zero, but there was probably a 1-5% chance of it happening. You can adjust for this by adding multiple normal curves and giving different weights to each curve, though I’m not sure how to do the scoring with this.
It also doesn’t work well for exponential behavior. For COVID cases in a given period, a few days difference in changing behavior could alter the number of deaths by a factor of 2 or more. That can be easily rectified though by putting your predictions in log form, but you have to remember to do that.
Overall though, normal predictions work well for most predictions, and we’d be better off using them!
Good Points, Everything is a conditional probability, so you can simply make conditional normal predictions:
Let A = Biden alive
Let B = Biden vote share
Then the normal probability is conditional on him being alive and does not count otherwise :)
Another solution is to make predictions from a T-distribution to get fatter tails. and then use "Advanced trick 3" to transform it back to a normal when calculating your calibration.
Given also the fact that many significant events seem to occur with on distributions with fat tails, assuming normal distributions may lead you to be systematically overconfident in your predictions. Though it's still probably far, far better than using binary estimates.
You could make predictions from a t distribution to get fatter tails, but then the "easy math" for calibration becomes more scary... You can then take the "quartile" from the t distribution and ask what sigma in the normal that corresponds to. That is what I outlined/hinted at in the "Advanced Techniques 3"
One of the things I like about a Brier Score is that I feel like I intuitively understand how it rewards calibration and also decisiveness.
It is trivial to be perfectly calibrated on multiple choice (with two choices being a "binary" multiple choice answer) simply by throwing decisiveness out the window: generate answers with coin flips and give confidence for all answers of 1/N. You will come out with perfect calibration, but also the practice is pointless, which shows that we intuitively don't care only about being calibrated.
However, this trick gets a very bad (edited from low thanks to GWS for seeing the typo) Brier Score, because the Brier Score was invented partly in response to the ideas that motivate the trick :-)
We also want to see "1+1=3" and assign it "1E-7" probability, because that equation is false and the uncertainty is more likely to come from typos and model error and so on. Giving probabilities like this will give you very very very low Brier Scores... as it should! :-)
The best possible Brier Score is 0.0 in the same way that the best RMSE is 0.0. This is reasonable because the RMSE and Brier Score are in some sense the same concept.
It makes sense to me that for both your goal is to make them zero. Just zero. The goal then is to know all the things... and to know that you know them by getting away with assigning everything very very high or very very low probabilities (and thus maxing the decisiveness)! <3
Second we calculate as the RMSE (root mean squared error) of all predictions... Then we calculate ...
So if these were my only two predictions, then I should widen my future intervals by 73%. In other words, because is 1.73 and not 1, thus my intervals are too small by a factor of 1.73.
I'm not sure if you're doing something conceptually interesting here (like how Brier Scores interestingly goes over and above mere "Accuracy" or mere "Calibration" by taking several good things into account in a balanced way), or... maybe... are you making some sort of error?
RMSE works with nothing but point predictions. It seems like you recognize that the standard deviations aren't completely necessary when you write:
(1) If the data and the prediction are close, then you are a good predictor
Thus maybe you don't need to also elicit a distribution and a variance estimate from the predicter? I think? There does seem to be something vaguely pleasing about aiming for an RMSE of 1.0 I guess (instead of aiming for 0.00000001) because it does seem like it would be nice for a "prediction consumer" to get error bars as part of what the predictor provides?
But I feel like this might be conceptually akin to sacrificing some of your decisiveness on the altar of calibration (as with guessing randomly over outcomes and always using a probability of 1/N).
The crux might be something like a third thing over and above "decisiveness & calibration" that is also good and might be named... uh... "non-hubris"? Maybe "intervalic coherence"? Maybe "predictive methodical self-awareness"?
Is it your intention to advocate aiming for RMSE=1.0 and also simultaneously advocate for eliciting some third virtuous quality from forecasters?
Note 1 for JenniferRM: I have updated the text so it should alleviate your confusion, if you have time, try to re-read the post before reading the rest of my comment, hopefully the few changes should be enough to answer why we want RMSE=1 and not 0.
Note 2 for JenniferRM and others who share her confusion: if the updated post is not sufficient but the below text is, how do I make my point clear without making the post much longer?
With binary predictions you can cheat and predict 50/50 as you point out... You can't cheat with continuous predictions as there is no "natural" midpoint.
The insight you are missing is this:
- I "try" to Convert my predictions to the Normal N(0, 1) using the predicted mean and error.
- The variance of the unit Normal is 1: Var(N(0, 1)) = 1^2 = 1
- If my calculated variance deviate from the unit normal, then that is evidence that I am wrong, I am making the implicit assumption that I cannot make "better point predictions" (change ) and thus is forced to only update my future uncertainty interval by .
To make it concrete, If I had predicted (sigma here is 10 wider than in the post):
- Biden ~ N(54, 30)
- COVID ~ N(15.000, 50.000)
then the math would give . Both the post predictions and the "10 times wider predictions in this comment" implies the same "recalibrated" :
(On a side note I hate brier scores and prefer Bernoulli likelihood, because brier says that predicting 0% or 2% on something that happens 1% of the time is 'equally wrong' (same square error)... where the Bernoulli says you are an idiot for saying 0% when it can actually happen)
When I google for [Bernoulli likelihood] I end up at the distribution and I don't see anything there about how to use it as a measure of calibration and/or decisiveness and/or anything else.
One hypothesis I have is that you have some core idea like "the deep true nature of every mental motion comes out as a distribution over a continuous variable... and the only valid comparison is ultimately a comparison between two distributions"... and then if this is what you believe then by pointing to a different distribution you would have pointed me towards "a different scoring method" (even though I can't see a scoring method here)...
Another consequence of you thinking that distributions are the "atoms of statistics" (in some sense) would (if true) imply that you think that a Brier Score has some distribution assumption already lurking inside it as its "true form" and furthermore that this distribution is less sensible to use than the Bernoulli?
...
As to the original issue, I think a lack of an ability, with continuous variables, to "max the calibration and totally fail at knowing things and still get an ok <some kind of score> (or not be able to do such a thing)" might not prove very much about <that score>?
Here I explore for a bit... can I come up with a N(m,s) guessing system that knows nothing but seems calibrated?
One thought I had: perhaps whoever is picking the continuous numbers has biases, and then you could make predictions of sigma basically at random at first, and then as confirming data comes in for that source, that tells you about the kinds of questions you're getting, so in future rounds you might tweak your guesses with no particular awareness of the semantics of any of the questions... such as by using the same kind of reasoning that lead you to concluding "widen my future intervals by 73%" in the example in the OP.
With a bit of extra glue logic that says something vaguely like "use all past means to predict a new mean of all numbers so far" that plays nicely with the sigma guesses... I think the standard sigma and mean used for all the questions would stabilize? Probably? Maybe?
I think I'd have to actually sit down and do real math (and maybe some numerical experiments) to be sure that it would. But is seems like the mean would probably stabilize, and once the mean stabilizes the S could be adjusted to get 1.0 eventually too? Maybe some assumptions about the biases of the source of the numbers have to be added to get this result, but I'm not sure if there are any unique such assumptions that are privileged. Certainly a Gaussian distribution seems unlikely to me. (Most of the natural data I run across is fat-tailed and "power law looking".)
The method I suggest above would then give you a "natural number scale and deviation" for whatever the source was for the supply of "guess this continuous variable" puzzles.
As the number of questions goes up (into the thousands? the billions? the quadrillions?) I feel like this content neutral sigma could approach 1.0 if the underlying source of continuous numbers to estimate was not set up in some abusive way that was often asking questions whose answer was "Graham's Number" (or doing power law stuff, or doing anything similarly weird). I might be wrong here. This is just my hunch before numerical simulations <3
And if my proposed "generic sigma for this source of numbers" algorithm works here... it would not be exactly the same as "pick an option among N at random and assert 1/N confidence and thereby seem like you're calibrated even though you know literally nothing about the object level questions" but it would be kinda similar.
My method is purposefully essentially contentless... except it seems like it would capture the biases of the continuous number source for most reasonable kinds of number sources.
...
Something I noticed... I remember back in the early days of LW there was an attempt to come up with a fun game for meetups that exercises calibration on continuous variables. It ended up ALSO needing two numbers (not just a point estimate).
The idea was to have have a description of a number and a (maybe implicitly) asserted calibration/accuracy rate that a player should aim for (like being 50% confident or 99% confident or whatever).
Then, for each question, each player emits two numbers between -Inf and +Inf and gets penalized if the true number is outside their bounds, and rewarded if the true number is inside, and rewarded more for a narrower bound than anyone else. The reward schedule should be such that an accuracy rate they have been told to aim for would be the winning calibration to have.
One version of this we tried that was pretty fun and pretty easy to score aimed for "very very high certainty" by having the scoring rule be: (1) we play N rounds, (2) if the true number is ever outside the bounds you get -2N points for that round (enough to essentially kick you out of the "real" game), (3) whoever has the narrowest bounds that contains the answer gets 1 point for that round. Winner has the most points at the end.
Playing this game for 10 rounds, the winner in practice was often someone who just turned in [-Inf, +Inf] for every question, because it turns out people seem to be really terrible at "knowing what they numerically know" <3
The thing that I'm struck by is that we basically needed two numbers to make the scoring system transcend the problems of "different scales or distributions on different questions".
That old game used "two point estimates" to get two numbers. You're using a midpoint and a fuzz factor that you seem strongly attached to for reasons I don't really understand. In both cases, to make the game work, it feels necessary to have two numbers, which is... interesting.
It is weird to think that this problem space (related to one-dimensional uncertainty) is sort of intrinsically two dimensional. It feels like something there could be a theorem about, but I don't know of any off the top of my head.
There is a new game currently sold at Target that is about calibration and estimation.
Each round has two big numbers, researched from things like "how many youtube videos were uploaded per hour in 2020?" Or "how many pounds does Mars weigh?" Each player guesses how much larger one is than the other (ie 2x, 5x. 10x, 100x, 1000x), and can bet on themselves if they are confident in thier estation.
Rather than using z-scoring, one can use log probabilities to measure prediction accuracy. They are computed by .
A downside is that they are not scale invariant, but instead the unit you measure in leads to a constant offset. I don't know whether one can come up with a scale invariant version. (I think no, because changing the scale is symmetric with changing the prediction accuracy? Though if one has some baseline prediction, one can use that to define the scale.)
(If this makes no sense, then ignore it): Using an arbitrary distribution for predictions, then use its CDF (Universality of the Uniform) to convert to , and then transform to z-score using the inverse CDF (percentile point function) of the Unit Normal. Finally use this as in when calculating your calibration.
Well, this makes some sense, but it would make even more sense to do only half of it.
Take your forecast, calculate it's percentile. Then you can do all the traditional calibration stuff. All this stuff with z-scores is needlessly complicated. (This is how Metaculus does it's calibration for continuous forecasts)
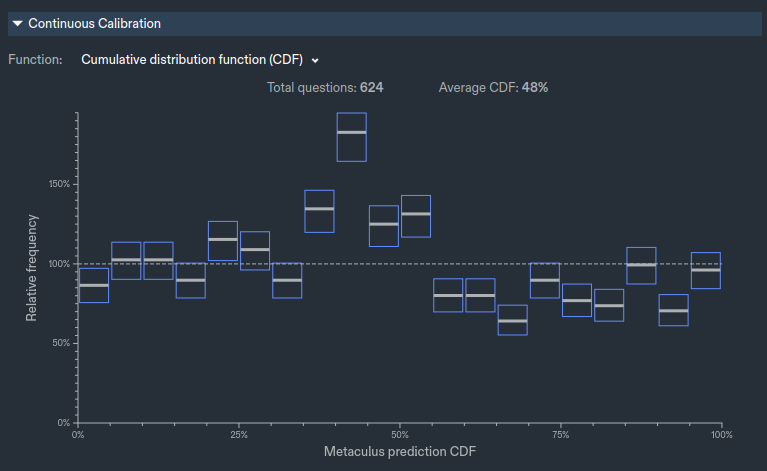
Can I use this image for my "part 2" posts, to explain how "pros" calibrate their continuous predictions?, And how it stacks up against my approach?, I will add you as a reviewer before publishing so you can make corrections in case I accidentally straw man or misunderstand you :)
I will probably also make a part 3 titled "Try t predictions" :), that should address some of your other critiques about the normal being bad :)
This is a good point, but you need less data to check whether your squared errors are close to 1 than whether your inverse CDF look uniform, so if the majority of predictions are normal I think my approach is better.
The main advantage of SimonM/Metaculus is that it works for any continuous distribution.
you need less data to check whether your squared errors are close to 1 than whether your inverse CDF look uniform
I don't understand why you think that's true. To rephrase what you've written:
"You need less data to check whether samples are approximately N(0,1) than if they are approximately U(0,1)"
It seems especially strange when you think that transforming your U(0,1) samples to N(0,1) makes the problem soluble.
TLDR for our disagreement:
SimonM: Transforming to Uniform distribution works for any continuous variable and is what Metaculus uses for calibration
Me: the variance trick to calculate from this post is better if your variables are form a Normal distribution, or something close to a normal.
SimonM: Even for a Normal the Uniform is better.
I disagree with that characterisation of our disagreement, I think it's far more fundamental than that.
- I think you misrepresent the nature of forecasting (in it's generality) versus modelling in some specifics
- I think your methodology is needlessly complicated
- I propose what I think is a better methodology
To expand on 1. I think (although I'm not certain, because I find your writing somewhat convoluted and unclear) that you're making an implicit assumption that the error distribution is consistent from forecast to forecast. Namely your errors when forecasting COVID deaths and Biden's vote share come from some similar process. This doesn't really mirror my experience in forecasting. I think this model makes much more sense when looking at a single model which produces lots of forecasts. For example, if I had a model for COVID deaths each week, and after 5-10 weeks I noticed that my model was under or over confident then this sort of approach might make sense to tweak my model.
To expand on 2. I've read your article a few times and I still don't fully understand what you're getting at. As far as I can tell, you're proposing a model for how to adjust your forecasts based on looking at their historic performance. Having a specific model for doing this seems to miss the point of what forecasting in the real world is like. I've never created a forecast, and gone "hmm... usually when I forecast things with 20% they happen 15% of the time, so I'm adjusting my forecast down" (which is I think what you're advocating) it's more likely a notion of, "I am often over/under confident, when I create this model is there some source of variance I am missing / over-estimating?". Setting some concrete rules for this doesn't make much sense to me.
Yes, I do think it's much simpler for people to look at a list of percentiles of things happening, to plot them, and then think "am I generally over-confident / under-confident"? I think it's generally much easier for people to reason about percentiles than standard-deviations. (Yes, I know 68-95-99, but I don't know without thinking quite hard what 1.4 sd or 0.5 sd means). I think leaning too heavily on the math tends to make people make some pretty obvious mistakes.
I am sorry if I have straw manned you, and I think your above post is generally correct. I think we are cumming from two different worlds.
You are coming from Metaculus where people make a lot of predictions. Where having 50+ predictions is the norm and the thus looking at a U(0, 1) gives a lot of intuitive evidence of calibration.
I come from a world where people want to improve in all kids of ways, and one of them is prediction, few people write more than 20 predictions down a year, and when they do they more or less ALWAYS make dichotomous predictions. I expect many of my readers to be terrible at predicting just like myself.
You are reading a post with the message "raise the sanity waterline from 2% to 5% of your level" and asking "why is this better than making 600 predictions and looking at their inverse CDF", and the answer is: it's not, but it's still relevant because most people do not make 600 predictions and do not know what an inverse CDF is. I am even explaining what an normal distribution is because I do not expect my audience to know...
-
You are absolutely correct they probably do not share an error distribution. But I am trying to get people from knowing 1 distribution to knowing 2.
-
Scot Alexander makes a "when I predict this" then "it really means that", every year for his binary predictions, This gives him an intuitive feel for "I should adjust my odds up/down by x". I am trying to do the same for Normal Distribution predictions, so people can check their predictions.
-
I agree your methodology is superior :), All I propose that people sometimes make continuous predictions, and if they want to start doing that and track how much they suck, then I give them instructions to quickly getting a number for how well it is going.
I still think you're missing my point.
If you're making ~20 predictions a year, you shouldn't be doing any funky math to analyse your forecasts. Just go through each one after the fact and decide whether or not the forecast was sensible with the benefit of hindsight.
I am even explaining what an normal distribution is because I do not expect my audience to know...
I think this is exactly my point, if someone doesn't know what a normal distribution is, maybe they should be looking at their forecasts in a fuzzier way than trying to back fit some model to them.
All I propose that people sometimes make continuous predictions, and if they want to start doing that and track how much they suck, then I give them instructions to quickly getting a number for how well it is going.
I disagree that's all you propose. As I said in an earlier comment, I'm broadly in favour of people making continuous forecasts as they convey more information. You paired your article with what I believe is broadly bad advise around analysing those forecasts. (Especially if we're talking about a sample of ~20 forecasts)
I would love you as a reviewer of my second post as there I will try to justify why I think this approach is better, you can even super dislike it before I publish if you still feel like that when I present my strongest arguments, or maybe convince me that I am wrong so I dont publish part 2 and make a partial retraction for this post :). There is a decent chance you are right as you are the stronger predictor of the two of us :)
you are missing the step where I am transforming arbitrary distribution to U(0, 1)
medium confident in this explanation: Because the square of random variables from the same distributions follows a gamma distribution, and it's easier to see violations from a gamma than from a uniform, If the majority of your predictions are from a weird distributions then you are correct, but if they are mostly from normal or unimodal ones, then I am right. I agree that my solution is a hack that would make no statistician proud :)
Edit: Intuition pump, a T(0, 1, 100) obviously looks very normal, so transforming to U(0,1) and then to N(0, 1) will create basically the same distribution, the square of a bunch of normal is Chi^2, so the Chi^2 is the best distribution for detecting violations, obviously there is a point where this approximation sucks and U(0, 1) still works
you are missing the step where I am transforming arbitrary distribution to U(0, 1)
I am absolutely not missing that step. I am suggesting that should be the only step.
(I don't agree with your intuitions in your "explanation" but I'll let someone else deconstruct that if they want)
Hard disagree, From two data points I calculate that my future intervals should be 1.73 times wider, converting these two data points to U(0,1) I get
[0.99, 0.25]
How should I update my future predictions now?
If you think 2 data points are sufficient to update your methodology to 3 s.f. of precision I don't know what to tell you. I think if I have 2 data point and one of them is 0.99 then it's pretty clear I should make my intervals wider, but how much wider is still very uncertain with very little data. (It's also not clear if I should be making my intervals wider or changing my mean too)
I don't know what s.f is, but the interval around 1.73 is obviously huge, with 5-1-0 data points it's quite narrow if your predictions are drawn from N(1, 1.73), that is what my next post will be about. There might also be a smart way to do this using the Uniform, but I would be surprised if it's dispersion is smaller than a chi^2 distribution :) (changing the mean is cheating, we are talking about calibration, so you can only change your dispersion)
Where can I access this for my profile on Metaculus? I have everything unlocked but don't see it in the options.
Go to your profile page. (Will be something like https://www.metaculus.com/accounts/profile/{some number}/). Then in the track record section, switch from Brier Score to "Log Score (continuous)"
Curated. Predictions are the bread and butter of rationality, so I love this post advising on how to systematically do them better.
Thanks!, I am planing on writing a few more in this vein, currently I have some rough drafts of:
- 30% Done, How to callibrate normal predictions
- defence of my calibration scheme, and an explanation of how metaculus does.
- 10% Done, How to make overdispersed predictions
- like this one for the logistic and t distribution.
- 70% Done, How to calibrate binary predictions
- like this one + but gives a posterior over the callibration by doing an logistic regression with your predictions as "x" and outcome as "y"
I can't promise they will be as good as this one, but if they are not terrible then I would like them to be turned into a sequence :), how do I do this?
It is a pretty big ask of individuals (who perhaps are making a blog post with a list of yearly predictions, in the style of Slate Star Codex, theZvi, Matt Yglesias, or others) to do all this math in order to generate and evaluate Normal Predictions of continuous variables. I think your post almost makes more sense as a software feature request -- more prediction markets and other platforms should offer Metaculus-style tools for tweaking a distribution as a way of helping people generate a prediction:
- It would be awesome if a prediction market let me bet on the 2024 election by first giving me a little interactive tool where I could see how my ideas about the popular vote probability distribution might translate into a Democratic or Republican victory. Then I could bet on the binary-outcome market after exploring my beliefs in continuous-variable land.
- Perhaps blogging platforms like LessWrong or Substack could have official support for predictions -- maybe you start by inputting your percentage chance for a binary outcome, and then the service nudges you about whether you'd like to turn that prediction into a continuous variable, to disambiguate cases like your example of "N(50.67, 0.5), N(54, 3), N(58, 6)" all giving 91% odds of a win. This seems like a good way of introducing people to the unfamiliar new format of Normal Predictions.
The big ask is making normal predictions, calibrating them can be done automatically here is a quick example using google sheets: here is an example
I totally agree with both your points, This comment From a Metaculus user have some good objections to "us" :)
Thanks, I really enjoyed this post - this was a novel but persuasive argument for not using binary predictions, and I now feel excited to try it out!
One quibble - When you discuss calculating your calibration, doesn't this implicitly assume that your mean was accurate? If my mean is very off but my standard deviation is correct, then this method says my standard deviation is way too low. But maybe this is fine because if I have a history of getting the mean wrong I should have a wider distribution?
I'm not sure how to think about the proposed calibration rule --- it's a heuristic to approximate something, but I'm not sure what. Probably the right thing to approximate is "how much money could someone make by betting against me," which is proportional to something like the KL divergence or the earth mover's distance, depending on your model of what bets are available.
Anyway, if you're quite confident about the wrong value, somebody can take a bunch of money from you. You can think of yourself as having overestimated the amount of knowledge you had, and as you suggested, you can think of the correction as uniformly decreasing your knowledge estimate going forward.
Talking about the stdev being "correct" is perfectly sensible if the ground truth is actually normally distributed, but makes less sense as the distribution becomes less normal.
I agree, most things is not normal distributed and my callibrations rule answers how to rescale to a normal. Metaculus uses the cdf of the predicted distribution which is better If you have lots of predictions, my scheme gives an actionable number faster, by making assumptions that are wrong, but if you like me have intervals that seems off by almost a a factor of 2, then your problem is not the tails but the entire region :), so the trade of seems worth it.
Metaculus uses the cdf of the predicted distribution which is better If you have lots of predictions, my scheme gives an actionable number faster
You keep claiming this, but I don't understand why you think this
Yes, You can change future by being smarter and future by being better calibrated, my rule assumes you don't get smarter and therefore have to adjust only future .
If you actually get better at prediction you could argue you would need to update less than the RMSE estimate suggests :)
That's also how I conseptiolize it, you have to change your intervals because you are to stupid to make better predictions, if the prediction was always spot on then sigma should be 0 and then my scheme does not make sense
If you suck like me and get a prediction very close then I would probably say: that sometimes happen :) note I assume the average squared error should be 1, which means most errors are less than 1, because 02+22=2>1
If you suck like me and get a prediction very close then I would probably say: that sometimes happen :) note I assume the average squared error should be 1, which means most errors are less than 1, because 02+22=2>1
I assume you're making some unspoken assumptions here, because is not enough to say that. A naive application of Chebyshev's inequality would just say that .
To be more concrete, if you were very weird, and either end up forecasting 0.5 s.d. or 1.1 s.d. away, (still with mean 0 and average squared error 1) then you'd find "most" errors are more than 1.
I am making the simple observation that the median error is less than one because the mean squares error is one.
That isn't a "simple" observation.
Consider an error which is 0.5 22% of the time, 1.1 78% of the time. The squared errors are 0.25 and 1.21. The median error is 1.1 > 1. (The mean squared error is 1)
Yes you are right, but under the assumption the errors are normal distributed, then I am right:
If:
Then Which is much less than 1.
proof:
import scipy as sp

x1 = sp.stats.norm(0, 0.5).rvs(22 * 10000)
x2 = sp.stats.norm(0, 1.1).rvs(78 * 10000)
x12 = pd.Series(np.array(x1.tolist() + x2.tolist()))
print((x12 ** 2).median())
Under what assumption?
1/ You aren't "[assuming] the errors are normally distributed". (Since a mixture of two normals isn't normal) in what you've written above.
2/ If your assumption is then yes, I agree the median of is ~0.45 (although
from scipy import stats
stats.chi2.ppf(.5, df=1)
>>> 0.454936
would have been an easier way to illustrate your point). I think this is actually the assumption you're making. [Which is a horrible assumption, because if it were true, you would already be perfectly calibrated].
3/ I guess you're new claim is "[assuming] the errors are a mixture of normal distributions, centered at 0", which okay, fine that's probably true, I don't care enough to check because it seems a bad assumption to make.
More importantly, there's a more fundamental problem with your post. You can't just take some numbers from my post and then put them in a different model and think that's in some sense equivalent. It's quite frankly bizarre. The equivalent model would be something like:
Our ability to talk past each other is impressive :)
would have been an easier way to illustrate your point). I think this is actually the assumption you're making. [Which is a horrible assumption, because if it were true, you would already be perfectly calibrated].
Yes this is almost the assumption I am making, the general point of this post is to assume that all your predictions follow a Normal distribution, with as "guessed" and with a that is different from what you guessed, and then use to get a point estimate for the counterfactual you should have used. And as you point out if (counterfactual) then the point estimate suggests you are well calibrated.
In the post counter factual is
Mean deviation corresponds to Laplace-distributed predictions, rather than normally-distributed predictions.
But you can multiply mean deviation by 5/4 (technically sqrt(pi/2)) to get standard deviation, if the distribution is normal. I.e. the two measures are identical but mean deviation is far more intuitive and therefore likely to yield better guesstimates, no?
They're not equivalent if the distribution is skewed, because if you use a Laplace-distributed prediction, you maximize accuracy by guessing at the median value, rather than at the mean value.
Agreed, More importantly the two distribution have different kurtosis, so their tails are very different a few sigmas away
I do think the Laplace distribution is a better beginner distribution because of its fat tails, but advocating for people to use a distribution they have never heard of seems like a to tough sell :)
(If this makes no sense, then ignore it): Using an arbitrary distribution for predictions, then use its CDF (Universality of the Uniform) to convert to , and then transform to z-score using the inverse CDF (percentile point function) of the Unit Normal. Finally use this as in when calculating your calibration.
This glosses over an important issue: namely, how do you find (and score once you do find it) which distribution is correct?
(This issue occurs surprisingly often in my experience - one person thinks that a distribution has a thin tail, and another thinks that the distribution has a fat tail, but there's little enough data that both estimates are plausible. Of course, they give very different predictions for long-tail events.)
(Also, P(0 votes for Biden) is arguably significantly more likely than P(1 vote for Biden), in which case even the example chosen suffers from this issue of choosing the wrong distribution.)
I agree tails are important, but for callibration few of your predictions should land in the tail, so imo you should focus on getting the trunk of the distribution right first, and the later learn to do overdispersed predictions, there is no closed form solution to callibration for a t distribution, but there is for a normal, so for pedagogical reasons I am biting the bullet and asuming the normal is correct :), part 10 in this series 3 years in the future may be some black magic of the posterior of your t predictions using HMC to approximate the 2d posterior of sigma and nu ;), and then you can complain "but what about skewed distributios" :P
you should focus on getting the trunk of the distribution right first
...which then systematically underestimates long-tail risk, often significantly.
Making predictions is a good practice, writing them down is even better.
However, we often make binary predictions when it is not necessary, such as
Alternatively, we could make predictions from a normal distribution, such as ('~' means ‘comes from’):
While making "Normal" predictions seems complicated, this post should be enough to get you started, and more importantly to get you a method for tracking your calibration, which is much harder with dichotomous predictions.
The key points are these:
Things this post will answer:
Quick recap about the normal distribution
The normal distribution is usually written as N(μ,σ) has 2 parameters:
the 68-95-99.7 rule states that:
68% of your predictions should fall in μ±1σ
95% of your predictions should fall in μ±2σ
99.7% of your predictions should fall in μ±3σ
50% of the predictions should fall within 0.674≈23σ, which can be used as a quick spot check.
The last piece of Normal trivia we need to know is this: the variance of the Normal is simply σ2:
Var(N(μ,σ))=σ2
How to make predictions
To make a prediction, there are two steps. Step 1 is predicting μ. Step 2 is using the 68-95-99.7 rule to capture your uncertainty in μ.
I tried to predict Biden’s national vote share in the 2020 election. From the polls, I got 54% as a point estimate, so that seemed like a good guess for μ. For σ I used the 68-95-99.7 rule and tried to see what that would imply for different values of σ. Here is a table for 2-5%
σ=2 implies a 97.5% (95% interval + half a tail) chance that Biden would get more than 50% of the votes; I was not that confident. σ=4 implies a 84% chance that Biden would get more than 50% of the votes (68% + 32%/2), and a 16% chance Trump wins, I likewise found this too high, so I settled on σ=3.
Why do I want to do this
Biden Got 52% of the vote share, which was within 1 sigma of my prediction. There are two weak lessons that I drew from this ONE data point.
Imagine I instead had predicted Biden wins (the popular vote) 91%, well guess what he won, so I was right... and that is it. Thinking I should have predicted 80% because the pollsters screwed up seems weird, as that is a weaker prediction and the bold one was right! I would need to predict a lot of other elections to see whether I am over or under confident.
How to track your calibration
Note: In the previous section we used μ and σ for predictions. In this section we will use μi and σi where i is the index (prediction 1, prediction 2... prediction N). We will use ^σz for the calibration point estimate; this means that ^σz is a number such as 1.73. In the next post in this series, we will use σz for the calibration distribution, this means that σz is a distribution like your predictions and thus has an uncertainty.
I also made a terrible prediction, during the early lock down in 2020. I predicted N(15,000, 5,000) COVID deaths by 2022 in Denmark. It turned out to be 3,200, which is 15000−32005000=2.36 standard deviations away, so outside the 95% interval!
In this section we will transform your predictions to the Unit normal. This is called z-scoring, because if all predictions are on the same scale, then they are comparable
zideal∼N(0,1)Var(zideal)=12=1
Normally when you convert to z-scores you use the data itself to calculate μ and σ, which guarantee a N(0,1). Here, we will use our predicted μ and σ. This means there will be a discrepancy between zideal and our z. This discrepancy describes how under/over confident your intervals are, and thus describes your calibration, such that if ^σz = 2 then all your intervals should be twice as wide to achieve zrecalibrated∼N(0,1)
First we z-score our data by calculating how many σ they are away from the observed data x, using this formula:
zi=μi−xiσi
Second we calculate ^σz as the RMSE (root mean squared error) of all predictions:
Var(z)=N∑i=0Var(zi)=N∑i=0z2i^σz=√Var(z)N
And that is, let's calculate ^σz for my two predictions, first we calculate the variances:
Then we calculate ^σz
^σz=√Var(z)N=√49+5.572=1.73
So if these were my only two predictions, then I should widen my future intervals by 73%. In other words, because ^σz is 1.73 and not 1, thus my intervals are too small by a factor of 1.73. If I instead had gotten ^σz<1, such as ^σz=0.5 then this would be evidence that my intervals were to wide and should be "scaled back" by multiplying my intervals by 0.5.
Still not convinced?
Here are some bonus arguments:
Advanced Techniques
Sometimes your beliefs do not follow a Normal distribution. For example, the Bitcoin prediction N(3000, 1500) implies I believe there is a 2.5% chance the price will become negative, which is impossible. There are 3 solutions in increasing order of fanciness to deal with this:
Bitcoin∼0.5HN(3000,σup=3000)+0.5HN(3000,σdown=1500)
This means if it's above then σ=3000, while if it's below then σ=1500. If you do this, then you can use "the relevant σ" when calibrating and ignore the other one, so if the price of bitcoin ended up being x=10.000 then z becomes 73:
z=3000−100003000=−73
μ=log10(3000)≈3.477σ=log10(2)≈0.301log10(Bitcoin)∼N(3.477,0.301)
z-scoring works the same way, so if the Bitcoin price was 10.000 then:
log10(x)=log10(10.000)=4z≈3.477−40.301≈−1.74
Final Remarks
I want you to stop and appreciate that we can get a specific actionable number after 2 predictions, which is basically impossible with binary predictions! So start making normal predictions, rather than dichotomous ones!
As a final note, keep this distinction in mind:
Getting good at 1 requires domain knowledge for each specific prediction, while getting good at 2 is a general skill that applies to all predictions.
This post we calculated the point estimate ^σz=1.73 based on 2 data points. There is a lot of uncertainty in a point estimate based on two data points, so we should expect the calibration distribution over σz to be quite wide. The next post in this series will tackle this by calculating a Frequentest confidence interval for ^σz and a Bayesian posterior over σz. This allows us to make statements such as: I am 90% confident that 1<σz, so it's much more likely that I am badly calibrated than unlucky. With only two data points it is however hard to tell the difference with much confidence.
Finally I would like to thank my editors Justis Mills and eric135 for making this readable.