Considering my options for following without needing to remember to check the site: what gets posted into the newsletter, and how frequent are the updates? Is there an RSS feed?
Substack automatically creates RSS feeds for the blogs it hosts, just add /feed to the end of the blog URL. For example, https://baseratetimes.substack.com/feed
Newsletter (coming soon) is going to include a weekly summary (changes in forecasts, latest headlines).
Ideally I'd like to do something more value-added/original than that as well. For example, I love the Nonrival newsletter (hat tip Nuno Sempere), which collects forecasts from its readers - check them out!
Re: RSS, thanks Garrett. Will add an RSS for the website as well, but the way I've set things up doesn't make it straightforward (I don't update via 'new posts' on a CMS).
Another way to stay updated without checking the site is my twitter (@base_rate_times), if that helps.

Very cool, and useful. There's another news innovation I've been enjoying - https://www.newsminimalist.com/ is chatgpt-ranked news stories, filtered to most novel, important, and credible. It does have links to sources, in addition to summaries.
I would LOVE to see a combination prediction market and news source. Either AI-generated links to relevant news stories, or better yet, links to prediction graphs relevant to news stories identified as interesting by some criteria.
The goal of The Base Rate Times is to be a combination of prediction markets and news aggregator. Right now on the site there are links to the latest stories with AI-generated bullet-point summaries.
I've been trying to link news stories to prediction markets, but still figuring out a more systematic way of doing it.

I am currently testing how to make AI article summaries even better. My goals are for AI to:
- find historical data to contextualise the story
- advise forecast updates based on the story
- make counter-arguments
- translate articles from e.g. Chinese
- detect bias & cross-reference claims
Yes, I love News Minimalist and check it everyday! But I don't want to just directly rip them off!
I've been thinking about how to use AI for news curation in a way that's original and specific to The Base Rate Time's mission (news via prediction markets).
I don't see a way to click into individual charts to be able to zoom / see them in more detail. They're a bit crammed on the main page, which is fine for a summary but not great as the only way to view them.
In general it's a bit weird to have a news website with no way to click into a headline and see more information. Maybe that's OK for now, but it is surprising as a user. Perhaps you could link to or quote comments from the prediction market websites, or recent related news articles?
Are you using the same fonts as NYT? Probably better to use different ones to distinguish your site.
You've got various little weirdness with your borders and formatting. E.g.: the gray vertical lines between columns start at different points near the top. The spacing between the icons next to "Follow" and "Newsletter" is too close.
This is a very cool project, hope it continues!
This is useful feedback, thank you.
Re headers and charts. I think what I will do is this: Click on headline --> separate page with full sized chart (and the news links, more info etc)
Re fonts. Yes, the design is 'inspired' by the NYT (and the motto by WaPo). It's kinda meant to be little bit of a pretentious 'performance art' making fun of major newspapers. What if NYT was founded in the era of prediction markets? kinda thing
Re formatting. Thanks, I've fixed the spacing. The borders is a deliberate choice believe it or not! The idea is to elevate the highest level headers (e.g. Russia-Ukraine) above the borders, to make it clear that a new topic has started. I tried 'fixing' the borders, but at least to my eyes it looked worse to be honest - I'll keep fidgeting...
Thank you again! It will continue
This site is a cool innovation but missing pieces required to be really useful. I’m giving it +1. I might give it +4 to subsidize ‘actually build shit’.
I think this site is on-the-path to something important but a) the UI isn't quite there and b) there's this additional problem where, well, most news doesn't matter (in that it doesn't affect my decisions).
During Ukraine nuclear scares, I looked at BaseRateTimes sometimes to try and orient, but I think it was less helpful than other compilations of prediction markets that Lightcone made specifically to help orient to nuclear threats.
I do think combining multiple prediction platforms into a single page is a pretty useful innovation and still seems likely to be a key piece of the final usable product I hope exists some day.
Things that feel missing:
- good UI for tailoring the page to suit my interests and decisionmaking
- ...more context, or something, for each market?
I assume one problem here is that matching up markets from different platforms with similar enough resolution criteria is hard. (Seems like something AI may be able to automate now?)
Curated.
I've heard people vaguely wishing for this sort of product for a few years, and I feel pretty excited looking at the potential here.
There's a lot of room for improvement, some of which is UI here, and some of which depends on how individual predictions and prediction-market-communities turn out to evolve. But I think the current product is above the bar of worth taking a look at and signal boosting. I hadn't consciously thought through the lens of "[Prediction], platforms’ UX is orientated towards forecasters, not information consumers", which seems like an obvious font of potential innovation.
I think this is a great project! Have you considered adding a donation button or using Patreon to allow readers to support the project?
I do have one big issue with the current way the information is presented: one of the most important things to take into account when making and interpreting predictions is the timeframe of the question. For example, if your are asking about the probability that Putin losses power, they the probability would likely be twice as high if you consider a 2 year timeframe compared to a 1 year time frame, assuming the probability per month does not change much.
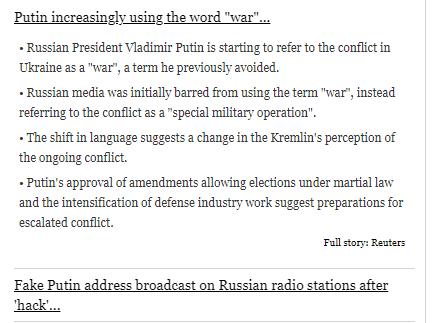
Currently, the first 5 top-level headlines all ignores the timeframe, making the headlines meaningless: “Putin >90% likely to remain in power, no change” “Odds of ceasefire ~15%, recovering from ~12% low” “Russia ~85% likely to gain territory, up from ~78%” “Crimea land bridge ~30% chance of being cut, no change” “Escalation: ~5% risk of NATO clash with Russia, down from ~9%”
The last one is particularly misleading. It compares the probabilities from start April to the probabilities now (start June). But one of the markets have deadline on June 12th and the other prediction have deadline July 1, so it is not surprising that the probability is down!
In order to conclude that the risk is decreasing, the question should have a moving deadline. I’m not aware of any prediction sites that allows questions with a moving timeframe, although it would be a great feature to have.
One thing that I have seen on manifold is markets that will resolve at a random time, with a distribution such that at any time, their expected duration (from the current day, conditional on not having already resolved) is 6 months. They do not seem particularly common, and are not quite equivalent to a market with a deadline exactly 6 months in the future. (I can't seem to find the market.)
Thank you!
I've fixed the last headline now. I agree that it was being driven by the resolution date and therefore misleading.
I'm curious what you think of e.g. the Putin headline. Of the 8 Putin markets, some resolve by July, some by October, and most by 2024 -- but all of them show ~90% or better odds (well, Hypermind is at 88%). So even if technically correct, would including the resolution dates really add value?
Especially on an data-ink ratio basis?
Most prediction markets used on the site resolve by 2024 (unless specified otherwise on the chart). It would feel redundant to include "by 2024" in every single headline?
My subjective impression is that odds start collapsing as the resolution date gets near, more so than some linear decline as the market window slowly closes. Some markets do trend down (peace odds), but others sideways (Putin, Crimea), and others trend up (Russian territory gain). So my current sense is that as long as headlines don't overweight markets closing within say ~2 months, it's probably okay?
Anyway am still very open to feedback on this. Just trying to navigate the trade-off of keeping things simple on an already cluttered site...
Thanks again, it was a stimulating post and I think this is going to be an important issue for me to get right. Will keep thinking about it.
Oh, I've also added a Patreon button now. Warning: no benefits yet! Purely to support the mission
Sorry my last comments wasn’t very constructive. I was also confusing two different critisisms:
- that some changes in predicted probabilities are due to the deadline getting closer and you need to make sure not to claim that as news, and
- that deadlines are not the in headlines and not always in the graphs either.
About 2): I don’t actually think this is much of a problem, if you ensure that the headline is not misleading and that the information about deadlines is easily available. However if the headline does not contain a deadline, and the deadline is relevant, I would not write any percentages in it. Putin has a 100% chance of dying, just like the rest of us, so it doesn’t make sense to say he has 90% chance of staying in power. In that case, I would prefer the headline to just state the direction the probability is moving in, e.g. “Putin hold on power in Russia is as stable as 3 month ago” or something like that.
To avoid writing “by 2024” in all headlines, maybe you could create subsections of the site by deadline. It would be a good user experince if you could feel like you are scrolling further into the future, starting with predictions for start of 2024, then 2025, then 2030. Of course this requires that there are several predictions for each deadline.
About 1), I think you should only include predictions if they cannot be explained by the nearing deadline.
For some questions this is not a problem at all, e.g. who is going to win an election.
For questions about whether something happens within a given timeframe, the best solution would be if prediction sites started making predictions with constant timeframe (e.g. 1 year) instead of constants deadline. I made a feature request about this to metaculous. They said they liked the idea, but they did not provide any prediction of the probability it would be implemented!
An alternative is to ask for a probability distribution for when something is going to happen. Such questions already exists on metaculous. Then you can see of expected remaining time or if time until median prediction is increasing, or something similar.
For questions with a fixed deadline, if the predicted probability of something happening is increasing, you can still conclude that the event is getting more likely.
For questions with fixed deadline and declining probabilities, it is harder to conclude anything. The very naive prediction would be linear decline, so p(t)/t is constant, where t denote time left and p(t) the probability at that time. E.g. with one month left t=1/12. A slightly less naive solution would be to model the event having constant probability at any time given that is hasn’t already happened. In this case, the constant would be log(1-p(t))/t.
In this model, if the probability is declining faster, meaning that |log(1-p(t))/t| is decreasing, I would stay that is a signal that the probability of the event is getting lower.
If p(t) is declining, but slow enough that |log(1-p(t))/t| is increasing, I would not conclude anything based on that, at least not on metaculus, because people forget to update their predictions sufficiently. I’m not familiar with other prediction sites, maybe it works better when there is money at stakes.
However, this model does not apply for all questions. It would be a useful model for e.g. “will there be a big cyber attack of a given type by a given date” that happens without warning, but for other questions like “Will Putin loose power be a given date”, we might expect some further indication of it happening before it happens, so we would expect the probability to go to 0 faster. For such questions questions, I don’t think you should ever conclude that the underlying event is getting less likely for a single fixed-deadline question.
So to conclude: if predicted probability of some event happing before the deadline is going up, it is fair to report it as the probability going up. If the prediction is going down you should only in rare cases conclude on the. The rare case is if you think the event would happen without much notice and |log(1-p(t))/t| is decreasing.
I'd encourage not relying on Twitter as your source of advice. perhaps user polling might be appropriate?
Nitpick: None of the listed sources except for Polymarket, Insight, Kashi, and maybe Manifold are technically prediction markets (I may have missed an exception), since they don't include a betting aspect, only a forecast accuracy metric they apply to the forecasters.
True! I'm just trying to keep it simple
Open to feedback for a better 'catch all' term
(I feel like 'forecasts' doesn't capture the fact that this aren't my forecasts and 'wisdom of the crowds' isn't concrete enough)
How about “prediction sites”? Although that could include other things like 538. Not sure if you want to exclude them.
I think it probably makes sense to use less artificial intelligence to put things into context, and instead focus on providing information with high quality instead of information with high quantity. I guess you could use AI to provide high quality information, but I also guess that by default you end up providing a large quantity, since that's a lot easier to do.
If I want a fire-hose of information, I can just use ChatGPT myself (or google, or wikipedia, or read the comments on the prediction market websites, etc.). And I anticipate I'll just be kinda annoyed if you provide me with the same type of info, but less useful since I wasn't the one who wrote the ChatGPT prompt.
Or maybe you spend a bunch of time on prompt engineering and I don't get annoyed, in that case, go right ahead and use AI, and it will probably turn out fine.
Eventually I would like to commission more high quality content from e.g. superforecasters.
I'm also working to improve the AI-summaries... eg wouldn't it be cool if I could get AI to find historical data to contextualise each news story?
Very cool! Personally, I currently avoid the news because it's not really relevant to my life, actionable, or something that tends to make me happy. The Base Rate Times doesn't seem to change any of that - fundamentally it's still news - and so I wouldn't use it.
Of course, not everyone is like me. Many people currently read/watch/consume the news. A lot of that is probably social positioning though, like watching CNN or reading NYT to better fit in with friends and family. I don't think The Base Rate Times would appeal to them.
But it does feel to me like there is some demographic for whom it would appeal to. Eg. rationalists and rationalist-adjacent people. To me it seems like an important step forward would be to figure out who these people are, where they hang out (physically or digitally), and what acquisition channels might work for them. The product honestly seems fine to me at the moment for the purpose of getting some sort of sign ups and feedback; my hunch is that it'd make sense to spend 70%+ of your time on marketing and user research.
Appreciate you trying it out
Agree, the key next steps is marketing/distribution and user research. Also ruffling up some funding!
Reading a book called 'The Mom Test' on user feedback now :)
I like the MVP! One comment re the idea of this becoming a larger thing in journalism, in relation to Goodhart's Law ("Once a measure becomes a target, it ceases to be useful as a measure"):
- Affecting policy and public opinion is a "target"
- "Real" journalism affects both public opinion and policy, and thus is a "proxy target"
- If "real" journalism started being affected by prediction markets, then prediction markets would also become a proxy target
- This would destroy their usefulness as measures
For example, even now, how much of the "85% chance Russia gains territory" is pure "wisdom of crowds" placing bets based on knowledge, and how much is the Kremlin buying "Russia gains territory" shares, in an effort to convince people that things will go well for them? If the NYT and the Washington Post -- and then Senators -- regularly quoted prediction markets, you can bet the latter would go into overdrive.
For prediction markets, I'm fine if they're consistently inaccurate because I, knowing their inaccuracies, would gain a bunch of money. But because there are smarter people than me who value money more than me, I expect those people will eat up the relevant money (unless the prediction market has a upper limit on how much a single person can bet like PredictIt). This is probably more of a problem for things like GJ Open or Metaculus, since their forecasts rely a bunch on crowd aggregations, so either they'd need to change the algorithms which report their publicly accessible forecasts, or in fact be less accurate.
In general, I think if NYT starts reporting on (say) Manifold Markets markets, I expect those markets to get a shit ton more accurate, even if NYT readers are tremendously biased.
As an example of how Manifold reacted to a (crude) attempt at manipulation:
Dr P (a Manifold user) would create and bet yes on markets for "Will Trump be president on [some date]?" for various dates where there was no plausible way trump would be president. Other users quickly noticed and set up limit orders to capture this source of free money. Eventually Dr. P's bets were cancelled out quickly enough that they had little to no effect on the probability, and it became hard to find one of those bets profit from. Eventually Dr P gave up and their account became inactive. (There was some uncertainty about what would happen if Dr P misresolved the markets. Today I would expect false resolutions to be reversed. Various derivative/insurance markets were set up.)
I've heard stories (unverified) that hedge funds manipulated political betting markets ahead of Brexit. Whatever loses you made betting would be more than offset by even a tiny shift in govt bonds or whatever.
If something like this happened, and the inherent correction mechanisms of a market were insufficient, I would probably just focus on the forecasts of top users.
I like this conceptually - might be nicer to aggregate all the prediction markets into an average by default (to make for cleaner graphs), and only split them up as an option.
If memory serves, Nate Silver managed to dominate some news cycles with his predictive model that mostly just aggregated opinion polls
I suspect I could do something similar. Look forward to "This super sophisticated model that definitely isn't just a weighted average of prediction markets predicated 49 out of 50 states!" coming soon to a mainstream newspaper near you
This is a fantastic project! Focus on providing value and marketing, and I really think this could be something big.
The LessWrong Review runs every year to select the posts that have most stood the test of time. This post is not yet eligible for review, but will be at the end of 2024. The top fifty or so posts are featured prominently on the site throughout the year.
Hopefully, the review is better than karma at judging enduring value. If we have accurate prediction markets on the review results, maybe we can have better incentives on LessWrong today. Will this post make the top fifty?
A bit silly perhaps, but: I’m really not a fan of the font choices and general look of it? Doesn’t look different enough from the NYT, even assuming that you did it on purpose, and the motto sounds weirdly pompous? But the layout itself seems quite clear.
Maybe also make the articles themselves more visible somehow?
I’m the kind of weirdo who rarely reads the news but enjoys having just the charts on how the situation’s evolving, and in that case, looking for info directly on prediction markets’ websites does the trick, right? What you bring is that you give both the articles explaining the situation in detail, and the info on how important it is. And that’s great, because one should care about both! But I guess it makes me think the articles could be a tiny bit more prominent. The idea of having article summaries, though, is great, since a lot of most articles tends to be filler anyway.
Anyway, wonderful idea! I’ll be reading that website often.
This is very much what I want my headlines to look like.
Personally, preferred mode of consumption would be AM email newsletter like Axios or Morning Brew.
The resolution dates on the markets seem important on several of the headlines and were noticeably missing from the body.
"Crimea land bridge 22% chance of being cut [this year/campaign season], down from 34% according to Insight"
Notice how different that would read with the time horizon on there vs leaving unqualified. The other big question an update like that begs is "what changed?"
I'm super excited for this! First impressions of site:
- The colorful graphs are eyecatching and fun. Some graphs have too much going on, with all the markets and different resolution criteria. Some visual simplification desired.
- It seems that platforms get different colors in different graphs? I desire each platform to have a consistent style.
- Icons rather than platform names all over the place would feel good
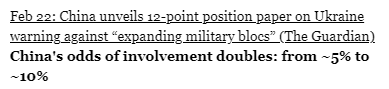
- I love the "China position paper" annotation. I want to see lots of that.
- On the US debt graph, one of the vertical line annotations is probably not displayed correctly: 'In 'In pri...
- Some underlined text is an actual link to another site, but other underlined text is an expandable section, which causes me confusion.
Introduction
I made a news site based on prediction markets
The Base Rate Times is a nascent news site that incorporates prediction markets prominently into its coverage.
Please see current iteration: www.baseratetimes.com
Twitter: www.twitter.com/base_rate_times
What problem does it solve?
Forecasts are underutilized by the media
Prediction markets are more accurate than pundits, yet the media has made limited use of their forecasts. This is a big problem: one of the most rigorous information sources is being omitted from public discourse!
The Base Rate Times creates prediction markets content, substituting for inferior news sources. This improves the epistemics of its audience.
Forecasts are dispersed, generally inconvenient to consume
Prediction markets are dispersed among many different platforms, fragmenting the information forecasters provide. For example, different platforms ask similar questions in different ways. Furthermore, platforms’ UX is orientated towards forecasters, not information consumers. Overall, trying to use prediction markets as ‘news replacement’ is cumbersome.
There is value in aggregating and curating forecasts from various platforms. We need engaging ways of sharing prediction markets’ insights. The Base Rate Times aims to make prediction markets easily digestible to the general public.
How does it work?
News media (emotive narrative) vs Base Rate Times (actionable odds)
For example, this is a real headline from a reputable newspaper: “Taiwan braces for China's fury over Pelosi visit”. Emotive and incendiary, it does not help you form an accurate model of the situation.
By contrast, The Base Rate Times: “China-Taiwan conflict risk 14%, up 2x from 7% after Pelosi visit”. That's an actionable insight. It can inform your decision on whether to stay in Taiwan or to flee, for example.
News aggregation, summarizing prediction markets
Naturally, the probabilities in the example above come from prediction markets. The Base Rate Times presents what prediction markets are telling us about news in an engaging way.
Stories that shift market odds are highlighted. And if a seemingly important story doesn’t shift market odds, that also tells you something.
On The Base Rate Times, right now you can see the latest odds on:
By glancing at a few charts, you can form a more accurate model (in less time) of Russia-Ukraine than reading countless narrative-based news stories.
Inspiration
A key inspiration was Scott Alexander’s Prediction Market FAQ:
Also Scott’s 'Mantic Monday' posts and Zvi’s blog.
This simple chart by @ClayGraubard was another inspiration. Wanted something like this, but for all major news stories. Couldn't find it, so making it myself. (Clay is making geopolitics videos and podcasts now, check it out.)
Goals
Like 538, but for prediction markets
The Base Rate Times is a bet that forecasts can be popularized, as opinion polls have been, and improve society’s models of the world.
Goal: Longshot probability of going mainstream, e.g. like 538.
If highly successful in scaling, we’d be effectively running an experiment on whether prediction can markets serve as early warning systems. For example, if there was a major newspaper consistently reporting a 1 in 3 risk of a global pandemic before COVID-19, would it have made a difference?
Future
Next topic the site will cover is Artificial Intelligence
Launched with coverage of Russia-Ukraine and Nuclear War (with a small sideline on US debt). The plan is to expand into a new ‘vertical’ every month, the topic being decided via Twitter polls (I am a man of the people). Coverage of AI will be launched in June.
AI-generated ‘enhanced’ article summaries
Currently news links are summarized by AI into 3-4 bullet points. Testing ways of enhancing these summaries, can AI…:
LessWrong-style reacts
As soon as I saw that ‘Key Insight’ react, I knew I had to steal it! Using LessWrong as an inspiration, the plan is to come up with ~5 reacts that are directly relevant to The Base Rate Times.
Community Notes-style overlay
Eventually I would like a ‘Community Notes’-style overlay on top of all of The Base Rate Times. For example, there might be a more liquid or better suited prediction market that I’ve missed. Or I might’ve grouped together markets in a way that requires more context. Readers could also correct AI-summaries and any headlines I might write.
Driving traffic to prediction platforms
Right now it’s not that convenient to go from The Base Rate Times to one of the referenced prediction markets. Plan is ‘instant check-out’ for placing a trade and easier clickthrough to the platforms.
Tagging tweets with prediction markets
Ever read a tweet (perhaps with a news link) and thought, ‘I bet that just isn’t true?’. Idea is to match dodgy viral tweets to relevant prediction markets.
Community Notes are well suited to adding missing info or making factual corrections. But prediction markets are better at fighting vague verbiage and contextualizing stories with concrete odds.
Helping top forecasters monetize their skillset
Prediction market traders are making a contribution to the public good by helping create accurate odds for current events. Unlike financial market traders, they are not richly compensated for ‘price discovery’ as many of the top platforms are ‘play money’. I have some ideas on how to get e.g. top Metaculus users paid, more on this later…
Feedback
Still in the MVP stage
This is an MVP -- I welcome any and every bit of feedback, big or small. Please feel free to be critical.
What's one thing you would change about the website?
Some specific areas you might like to comment on:
Grant suggestions please!
I would also appreciate any suggestions on grants (or other funding) to apply for.
Thank you for reading! If you made it this far, then damn u is gangsta af.