People who believed in high existential risk were ... more likely to believe in aliens (I found that same result last time, and it puzzled me then too.)
Aliens existing but not yet colonizing multiple systems or broadcasting heavily is the the response consistent with the belief that a Great Filter lies in front of us.
Strength of membership in the LW community was related to responses for most of the questions. There were 3 questions related to strength of membership: karma, sequence reading, and time in the community, and since they were all correlated with each other and showed similar patterns I standardized them and averaged them together into a single measure. Then I checked if this measure of strength in membership in the LW community was related to answers on each of the other questions, for the 822 respondents (described in this comment) who answered at least one of the probability questions and used percentages rather than decimals (since I didn't want to take the time to recode the answers which were given as decimals).
All effects described below have p < .01 (I also indicate when there is a nonsignificant trend with p<.2). On questions with categories I wasn't that rigorous - if there was a significant effect overall I just eyeballed the differences and reported which categories have the clearest difference (and I skipped some of the background questions which had tons of different categories and are hard to interpret).
Compared to those with a less strong membership in the LW...
Political Views - less likely to be socialist, more likely to be libertarian
I looked at this one a little more closely, and this difference in political views is driven almost entirely by the "time in community" measure of strength of membership in the LW community; it's not even statistically significant with the other two. I'd guess that is because LW started out on Overcoming Bias, which is a relatively libertarian blog, so the old timers tend to share those views. We've also probably added more non-Americans over time, who are more likely to be socialist.
All of the other relationships in the above post hold up when we replace the original measure of membership strength with one that is only based on the two variables of karma & sequence reading, but this one does not.
Running list of changes for next year's survey:
- Ask who's a poster versus a lurker!
- A non-write-in "Other" for most questions
- Replace "gender" with "sex" to avoid complaints/philosophizing.
- Very very clear instructions to use percent probabilities and not decimal probabilities
- Singularity year question should have explicit instructions for people who don't believe in singularity
- Separate out "relationship status" and "looking for new relationships" questions to account for polys
- Clarify that research is allowed on the probability questions
- Clarify possible destruction of humanity in cryonics/antiagathics questions.
- What does it mean for aliens to "exist in the universe"? Light cone?
- Make sure people write down "0" if they have 0 karma.
- Add "want to sign up, but not available" as cryonics option.
- Birth order.
- Have children?
- Country of origin?
- Consider asking about SAT scores for Americans to have something to correlate IQs with.
- Consider changing morality to PhilPapers version.
One about nationality (and/or native language)? I guess that would be much more relevant than e.g. birth order.
BTW, I'd also disallow 0 and 100, and give the option of giving log-odds instead of probability (and maybe encourage to do that for probabilities 99%). Someone's “epsilon” might be 10^-4 whereas someone else's might be 10^-30.
I expect this is incorrect.
Specifically, I would guess that you can distinguish the strength of your belief that a lottery ticket you might purchase will win the jackpot from one in a thousand (a.k.a. 0.1%). Am I mistaken?
I'd love a specific question on moral realism instead of leaving it as part of the normative ethics question. I'd also like to know about psychiatric diagnoses (autism spectrum, ADHD, depression, whatever else seems relevant)-- perhaps automatically remove those answers from a spreadsheet for privacy reasons.
I don't care about moral realism, but psychiatric diagnoses (and whether they're self-diagnosed or formally diagnosed) would be interesting.
You are aware that if you ask people for their sex but not their gender, and say something like "we have more women now", you will be philosophized into a pulp, right?
Suggestion: "Which of the following did you change your mind about after reading the sequences? (check all that apply)"
- [] Religion
- [] Cryonics
- [] Politics
- [] Nothing
- [] et cetera.
Many other things could be listed here.
When asking for race/ethnicity, you should really drop the standard American classification into White - Hispanic - Black - Indian - Asian - Other. From a non-American perspective this looks weird, especially the "White Hispanic" category. A Spaniard is White Hispanic, or just White? If only White, how does the race change when one moves to another continent? And if White Hispanic, why not have also "Italic" or "Scandinavic" or "Arabic" or whatever other peninsula-ic races?
Since I believe the question was intended to determine the cultural background of LW readers, I am surprised that there was no question about country of origin, which would be more informative. There is certainly greater cultural difference between e.g. Turks (White, non-Hispanic I suppose) and White non-Hispanic Americans than between the latter and their Hispanic compatriots.
Also, making a statistic based on nationalities could help people determine whether there is a chance for a meetup in their country. And it would be nice to know whether LW has regular readers in Liechtenstein, of course.
Strongly disagree with previous self here. I do not think replacing "gender" with "sex" avoids complaints or "philosophizing", and "philosophizing" in context feels like a shorthand/epithet for "making this more complex than prevailing, mainstream views on gender."
For a start, it seems like even "sex" in the sense used here is getting at a mainly-social phenomenon: that of sex assigned at birth. This is a judgement call by the doctors and parents. The biological correlates used to make that decision are just weighed in aggregate; some people are always going to throw an exception. If you're not asking about the size of gametes and their delivery mechanism, the hormonal makeup of the person, their reproductive anatomy where applicable, or their secondary sexual characteristics, then "sex" is really just asking the "gender" question but hazily referring to biological characteristics instead.
Ultimately, gender is what you're really asking for. Using "sex" as a synonym blurs the data into unintelligibility for some LWers; pragmatically, it also amounts to a tacit "screw you" to trans p...
Intriguingly, even though the sample size increased by more than 6 times, most of these results are within one to two percent of the numbers on the 2009 survey, so this supports taking them as a direct line to prevailing rationalist opinion rather than the contingent opinions of one random group.
This is not just intriguing. To me this is the single most significant finding in the survey.
If the readership of LessWrong has gone up similarly in that time, then I would not expect to see an improvement, even if everyone who reads LessWrong improves.
The supernatural (ontologically basic mental entities) exists: 5.38, (0, 0, 1)
God (a supernatural creator of the universe) exists: 5.64, (0, 0, 1)
??
P(Supernatural) What is the probability that supernatural events, defined as those involving ontologically basic mental entities, have occurred since the beginning of the universe?
P(God) What is the probability that there is a god, defined as a supernatural (see above) intelligent entity who created the universe?
So deism (God creating the universe but not being involved in the universe once it began) could make p(God) > p(Supernatural).
Looking at the the data by individual instead of in aggregate, 82 people have p(God) > p(Supernatural); 223 have p(Supernatural) > p(God).
So they believe that God created the universe, but has ceased to exist since.
We have 82 Nietzscheans.
It's a bit of a nonstandard definition of the supernatural, but I took it to mean mental phenomena as causeless nodes in a causal graph: that is, that mental phenomena (thoughts, feelings, "souls") exist which do not have physical causes and yet generate physical consequences. By this interpretation, libertarian free will and most conceptions of the soul would both fall under supernaturalism, as would the prerequisites for most types of magic, gods, spirits, etc.
I'm not sure I'd have picked that phrasing, though. It seems to be entangled with epistemological reductionism in a way that might, for a sufficiently careful reading, obscure more conventional conceptions of the "supernatural": I'd expect more people to believe in naive versions of free will than do in, say, fairies. Still, it's a pretty fuzzy concept to begin with.
"less likely to believe in cryonics"
Rather, believe the probability of cryonics producing a favorable outcome to be less. This was a confusing question, because it wasn't specified whether it's total probability, since if it is, then probability of global catastrophe had to be taken into account, and, depending on your expectation about usefulness of frozen heads to FAI's value, probability of FAI as well (in addition to the usual failure-of-preservation risks). As a result, even though I'm almost certain that cryonics fundamentally works, I gave only something like 3% probability. Should I really be classified as "doesn't believe in cryonics"?
(The same issue applied to live-to-1000. If there is a global catastrophe anywhere in the next 1000 years, then living-to-1000 doesn't happen, so it's a heavy discount factor. If there is a FAI, it's also unclear whether original individuals remain and it makes sense to count their individual lifespans.)
Michael Vassar has mentioned to me that the proportion of first/only children at LW is extremely high. I'm not sure whether birth order makes a big difference, but it might be worth asking about. By the way, I'm not only first-born, I'm the first grandchild on both sides.
Questions about akrasia-- Do you have no/mild/moderate/serious problems with it? Has anything on LW helped?
I left some of the probability questions blank because I realized had no idea of a sensible probability, and I especially mean whether we're living in a simulation.
It might be interesting to ask people whether they usually vote.
The link to the survey doesn't work because the survey is closed-- could you make the text of the survey available?
By the way, I'm not only first-born, I'm the first grandchild on both sides.
So am I! I wonder if being the first-born is genetically heritable.
Yes. Being first-born is correlated with having few siblings, which is correlated with parents with low fertility, which is genetically inherited from grandparents with low fertility, which is correlated with your parents having few siblings, which is correlated with them being first-born.
is correlated with [...] which is correlated with [...] which is genetically inherited from [...] which is correlated with
I agree with your conclusion that the heritability of firstbornness is nonzero, but I'm not sure this reasoning is valid. (Pearson) correlation is not, in general, transitive: if X is correlated with Y and Y is correlated with Z, it does not necessarily follow that X is correlated with Z unless the squares of the correlation coefficients between X and Y and between Y and Z sum to more than one.
Actually calculating the heritability of firstbornness turns out to be a nontrivial math problem. For example, while it is obvious that having few siblings is correlated with being firstborn, it's not obvious to me exactly what that correlation coefficient should be, nor how to calculate it from first principles. When I don't know how to solve a problem from first principles, my first instinct is to simulate it, so I wrote a short script to calculate the Pearson correlation between number of siblings and not-being-a-firstborn for a population where family size is uniformly distributed on the integers from 1 to n. It turns out that the correlation decreases as n gets lar...
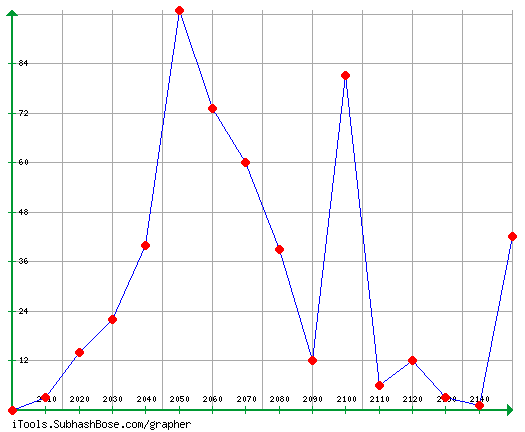
Just you look at all that ugly anchoring at 2100...
And yet if people don't round off at significant figures there are another bunch who will snub them for daring to provide precision they cannot justify.
Unfortunately, army1987, no one can be told when the Singularity is. You have to see it for yourself. This is your last chance; after this, there is no turning back. You choose to downvote... and the story ends. You wake in your bed and believe whatever you want to believe. You choose to upvote... and you stay in LessWrong.
Who answered 2010? Seriously?
To quote from the description here:
Note: each point (rather misleadingly) represents data for the next 10 years.
So: it represents estimates of 2012, 2015 and 2016.
However: someone answered "1990"!
This is probably the "NSA has it chained in the basement" scenario...
In case anyone's interested in how we compare to philosophers about ethics:
PhilPapers (931 people, mainly philosophy grad students and professors):
Normative ethics: deontology, consequentialism, or virtue ethics?
Other 301 / 931 (32.3%)
Accept or lean toward: deontology 241 / 931 (25.8%)
Accept or lean toward: consequentialism 220 / 931 (23.6%)
Accept or lean toward: virtue ethics 169 / 931 (18.1%)
LessWrong (1090 people, us):
With which of these moral philosophies do you MOST identify?
consequentialist (62.4%)
virtue ethicist (13.9%)
did not believe in morality (13.3%)
deontologist (4.5%)
The mean age was 27.18 years. Quartiles (25%, 50%, 75%) were 21, 25, and 30. 90% of us are under 38, 95% of us are under 45, but there are still eleven Less Wrongers over the age of 60....The mean for the Singularity question is useless because of the very high numbers some people put in, but the median was 2080 (quartiles 2050, 2080, 2150). The Singularity has gotten later since 2009: the median guess then was 2067.
So the 50% age is 25 and the 50% estimate is 2080? A 25 year old has a life expectancy of, what, another 50 years? 2011+50=2061, or 19 years short of the Singularity!
Either people are rather optimistic about future life-extension (despite 'Someone now living will reach age 1000: 23.6'), or the Maes-Garreau Law may not be such a law.
Intriguingly, even though the sample size increased by more than 6 times, most of these results are within one to two percent of the numbers on the 2009 survey, so this supports taking them as a direct line to prevailing rationalist opinion rather than the contingent opinions of one random group.
Maybe, but sort of fresh meat we get is not at all independent of the old guard, so an initial bias could easily reproduce itself.
There is intelligent life elsewhere in the Universe: 69.4, (50, 90, 99) There is intelligent life elsewhere in our galaxy: 41.2, (1, 30, 80)
Suggestion: Show these questions in random order to half of people, and show only one of the questions to the other half, to get data on anchoring.
I enjoy numbers as much as the next guy, but IMO this article is practically crying out for more graphs. The Google Image Chart API might be useful here.
The other 72.3% of people who had to find Less Wrong the hard way. 121 people (11.1%) were referred by a friend, 259 people (23.8%) were referred by blogs, 196 people (18%) were referred by Harry Potter and the Methods of Rationality, 96 people (8.8%) were referred by a search engine, and only one person (.1%) was referred by a class in school.
Of the 259 people referred by blogs, 134 told me which blog referred them. There was a very long tail here, with most blogs only referring one or two people, but the overwhelming winner was Common Sense Atheism, which is responsible for 18 current Less Wrong readers. Other important blogs and sites include Hacker News (11 people), Marginal Revolution (6 people), TV Tropes (5 people), and a three way tie for fifth between Reddit, SebastianMarshall.com, and You Are Not So Smart (3 people).
I've long been interested in whether Eliezer's fanfiction is an effective strategy, since it's so attention-getting (when Eliezer popped up in The New Yorker recently, pretty much his whole blurb was a description of MoR).
Of the listed strategies, only 'blogs' was greater than MoR. The long tail is particularly worrisome to me: LW/OB have frequently been li...
So people just got silly with the IQ field again.
That'd be problematic for people outside the US, unfortunately. I don't know the specifics of how most of the various non-US equivalents work, but I expect conversion to bring up issues; the British A-level exams, for example, have a coarse enough granularity that they'd probably taint the results purely on those grounds. Especially if the average IQ around here really is >= 140.
Yeah, but the difference is that the majority of people actually have SAT scores. It's pretty easy to go through your life without ever seeing the results of an IQ test, but I suspect there's a big temptation to just give a perceived "reasonable" answer anyway. I would rather have a lot of accurate results that are a little worse at discriminating than a lot of inaccurate results which would hypothetically be good at discriminating if they were accurate.
Yeah, but the difference is that the majority of people actually have SAT scores.
A majority of US people perhaps. Aargh the Americano-centrism, yet again.
Two obvious questions missing from the survey btw are birth country, and current country of residence (if different).
Note that in addition to being US-centric, the SAT scoring system has recently changed. When I took the SAT's, the maximum score was 1600, as it had two sections. Now it has 3 sections, with a maximum score of 2400. So my SAT score is going to look substantially worse compared to people who took it since 2005... and let's not even get into the various "recentering" changes in the 80's and 90's.
Significant anthropogenic global warming is occurring: 70.7, (55, 85, 95)
I'm rather shocked that the numbers on this are so low. It's higher than polls indicate as the degree of acceptance in America, but then, we're dealing with a public where supposedly half of the people believe that tomatoes only have genes if they are genetically modified. Is this a subject on which Less Wrongers are significantly meta-contrarian?
I'm also a bit surprised (I would have excepted high figures), but be careful to not misinterpret the data : it doesn't say that 70.7% of LWers believe in "anthropogenic global warming", but it does an average on probabilities. If you look at the quarters, even the 25% quarter is at p = 55% meaning that less than 25% of LWers give a lower than half probability.
It seems to indicate that almost all LWers believe in it being true (p>0.5 that it is true), but many of them do so with a low confidence. Either because they didn't study the field enough (and therefore, refuse to put too much strength in their belief) or because they consider the field too complicated/not well enough understood to be a too strong probability in it.
I would say that it's considerably more important for everyday life for most people than knowing whether tomatoes have genes.
I disagree actually.
For most people neither global warming nor tomatoes having genes matters much. But if I had to choose, I'd say knowing a thing or two about basic biology has some impact on how you make your choices with regards to say healthcare or how much you spend on groceries or what your future shock level is.
Global warming, even if it does have a big impact on your life will not be much affected by you knowing anything about it. Pretty much anything an individual could do against it has a very small impact on how global warming will turn out. Saving 50$ a month or a small improvement in the odds of choosing the better treatment has a pretty measurable impact on him.
Taking global warming as a major threat for now (full disclosure: I think global warming, is not a threat to human survival though it may contribute to societal collapse in a worst case scenario), it is quite obviously a tragedy of the commons problem.
There is no incentive for an individual to do anything about it or even know anything about it, except to conform to a "low carbon footprint is high status" meme in order to derive benefit in his social life and feeling morally superior to others.
Wait a sec. Global warming can be important for everyday life without it being important that any given individual know about it for everyday life. In the same way that matters of politics have tremendous bearing on our lives, yet the average person might rationally be ignorant about politics since he can't have any real effect on politics. I think that's the spirit in which thomblake means it's a political matter. For most of us, the earth will get warmer or it won't, and it doesn't affect how much we are willing to pay for tomatoes at the grocery store (and therefore it doesn't change our decision rule for how to buy tomatoes), although it may effect how much tomatoes cost.
(It's a bit silly, but on the other hand I imagine one could have their preferences for tomatoes depend on whether tomatoes had "genes" or not.)
This is a bit like the distinction between microeconomics and macroeconomics. Macroeconomics is the stuff of front page newspaper articles about the economy, really very important stuff. But if you had to take just one economics class, I would recommend micro, because it gives you a way of thinking about choices in your daily life, as opposed to stuff you can't have any real effect on.
Exactly, it IS the tragedy of the commons, but that supports my point, not yours. It may be good for society if people are more informed about global warming, but society isn't what makes decisions. Individuals make decisions, and it's not in the average individual's interest to expend valuable resources learning more about global warming if it's going to have no real effect on the quality of their own life.
Whether you think it's an individual's "job" or not to do what's socially optimal, is completely besides the point here. The fact is they don't. I happen to think that's pretty reasonable, but it doesn't matter how we wish people would behave, in order to predict how they will behave.
Let me try to be clear, since you might be wondering why someone (not me) downvoted you: You started by noting your shock that people aren't that informed about global warming. I said we shouldn't necessarily be surprised that they aren't that informed about global warming. You responded that we're suffering from the tragedy of the commons, or the tragedy of the rationalists versus the barbarians. I respond that I agree with what you say but not with what you seem to think it mean...
The average LessWronger is almost certainly much more competent to evaluate that global temperatures have been rising significantly, and that at least one human behavior has had a nontrivial effect on this change in temperature, than to evaluate that all life on earth shares a common ancestral gene pool, or that some 13.75 billion years ago the universe began rapidly inflating. Yet I suspect that the modern evolutionary synthesis (including its common-descent thesis), and the Big Bang Theory, are believed more strongly by LessWrongers than is anthropogenic climate change.
If so, then it can't purely be a matter of LessWrongers' lack of expertise in climate science; there must be some sociological factors undermining LessWrongers' confidence in some scientific claims they have to largely take scientists' word for, while not undermining LessWrongers' confidence in all scientific claims they have to largely take scientists' word for.
Plausibly, the ongoing large-scale scientific misinformation campaign by established economic and political interests is having a big impact. Merely hearing about disagreement, even if you have an excellent human-affairs model predicting such disagreement i...
Perhaps they also want to signal a sentiment similar to that of Freeman Dyson:
I believe global warming is grossly exaggerated as a problem. It's a real problem, but it's nothing like as serious as people are led to believe. The idea that global warming is the most important problem facing the world is total nonsense and is doing a lot of harm. It distracts people's attention from much more serious problems.
I would like to see this question on a future survey:
Are you genetically related to anyone with schizophrenia? (yes / no) How distant is the connection? (nuclear family / cousins, aunts and uncles / further / no connection)
I've repeatedly heard that a significant number of rationalists are related to schizophrenics.
Didn't the IQ section say to only report a score if you've got an official one? The percentage of people answering not answering that question should have been pretty high, if they followed that instruction. How many people actually answered it?
Also: I've already pointed out that the morality question was flawed, but after thinking about it more, I've realized how badly flawed it was. Simply put, people shouldn't have had to choose between consequentialism and moral anti-realism, because there are a number of prominent living philosophers who combine the two.
JJC Smart is an especially clear example, but there are others. Joshua Greene's PhD thesis was mainly a defense of moral anti-realism, but also had a section titled "Hurrah for Utilitarianism!" Peter Singer is a bit fuzzy on meta-ethics, but has flirted with some kind of anti-realism.
And other moral anti-realists take positions on ethical questions without being consequentialists, see i.e. JL Mackie's book Ethics. Really, I have to stop myself from giving examples now, because they can be multiplied endlessly.
So again: normative ethics and meta-ethics are different issues, and should be treated as such on the next survey.
So we can only prove that 519 people post on Less Wrong.
Where by 'prove' we mean 'somebody implied that they did on an anonymous online survey'. ;)
You mean, as opposed to that kind of proof where we end up with a Bayesian probability of exactly one? :)
Wouldn't it be (relatively) easy and useful to have a "stats" page in LW, with info like number of accounts, number of accounts with > 0 karma (total, monthly), number of comments/articles, ... ?
Wouldn't it be (relatively) easy and useful to have a "stats" page in LW, with info like number of accounts, number of accounts with > 0 karma (total, monthly), number of comments/articles, ... ?
Nice idea! I am interested in such statistics.
What's the relation between religion and morality? I drew up a table to compare the two. This shows the absolute numbers and the percentages normalized in two directions (by religion, and by morality). I also highlighted the cells corresponding to the greatest percentage across the direction that was not normalized (for example, 22.89% of agnostics said there's no such thing as morality, a higher percentage than any other religious group).
Many pairs were highlighted both ways. In other words, these are pairs such that "Xs are more likely to be Ys" and vice-versa.
- [BLANK]; [BLANK]
- Atheist and not spiritual; Consequentialist
- Agnostic; No such thing
- Deist/Pantheist/etc.; Virtue ethics
- Committed theist; Deontology
(I didn't do any statistical analysis, so be careful with the low-population groups.)
It looks like about 6% of respondents gave their answers in decimal probabilities instead of percentages. 108 of the 930 people in the data file didn't have any answers over 1 for any of the probability questions, and 52 of those did have some answers (the other 56 left them all blank), which suggests that those 52 people were using decimals (and that's is 6% of the 874 who answered at least one of the questions). So to get more accurate estimates of the means for the probability questions, you should either multiply those respondents' answers by 100, exclude those respondents when calculating the means, or multiply the means that you got by 1.06.
=IF(MAX(X2:AH2)<1.00001,1,0) is the Excel formula I used to find those 108 people (in row 2, then copy and pasted to the rest of the rows)
There was much derision on the last survey over the average IQ supposedly being 146. Clearly Less Wrong has been dumbed down since then, since the average IQ has fallen all the way down to 140.
...
The average person was 37.6% sure their IQ would be above average - underconfident!
Maybe people were expecting the average IQ to turn out to be about the same as in the previous survey, and... (Well, I kind-of was, at least.)
I would be interested in a question that asked whether people were pescatarian / vegetarian / vegan, and another question as to whether this was done for moral reasons.
Community veterans were more likely to believe in Many Worlds, less likely to believe in God, and - surprisingly - less likely to believe in cryonics (significant at 5% level; could be a fluke).
It might be a fluke, but like one other respondent who talked about this and got many upvotes, it could be that community veterans were more skeptical of the many many things that have to go right for your scenario to happen, even if we generally believe that cryonics is scientifically feasible and worth working on.
When you say "the average person cryonically frozen today will at some point be awakened", that means not only that the general idea is workable, but that we are currently using an acceptable method of preserving tissues, and that a large portion of current arrangements will continue to preserve those bodies/tissues until post singularity, however long that takes, and that whatever singularity happens will result in people willing to expend resources fulfullling those contracts (so FAI must beat uFAI). Add all that up, and it can easily make for a pretty small probability, even if you do "believe in cryonics" in the sense of thinking that it is potentially sound tech.
My interpretation of this result (with low confidence, as 'fluke' is also an excellent explanation) is that community veterans are better at working with probabilities based on complex conjunctions, and better at seeing the complexity of conjunctions based on written descriptions.
These averages strike me as almost entirely useless! If only half of the people taking the survey are lesswrong participants then the extra noise will overwhelm any signal when the probabilities returned by the actual members are near to either extreme. Using averaging of probabilities (as opposed to, say, log-odds) is dubious enough even when not throwing in a whole bunch of randoms!
(So thankyou for providing the data!)
As with the last survey, it's amazing how casually many people assign probabilities like 1% and 99%. I can understand in a few cases, like the religion questions, and Fermi-based answers to the aliens in the galaxy question. But on the whole it looks like many survey takers are just failing the absolute basics: don't assign extreme probabilities without extreme justification.
I am officially very surprised at how many that is. Also officially, poorly calibrated at both the 50% (no big deal) and the 90% (ouch, ouch, ouch) confidence levels.
Are there any significant differences in gender or age (or anything else notable) between the group who chose to keep their responses private and the rest of the respondents?
At least one person was extremely confident in the year of publication of a different Principia Mathematica :) It's easy to forget about the chance that you misheard/misread someone when communicating beliefs.
Almost everyone responding (75%) believes there's at least a 10% chance of a 90% culling of human population sometime in the next 90 years.
If we're right, it's incumbent to consider sacrificing significant short term pleasure and freedom to reduce this risk. I haven't heard any concrete proposals that seem worth pushing, but the proposing and evaluating needs to happen.
There is intelligent life elsewhere in the Universe: 69.4, (50, 90, 99)
There is intelligent life elsewhere in our galaxy: 41.2, (1, 30, 80)
You have to admit, that's pretty awful. There's only a 20% difference, is that so?
Older people were less likely to believe in transhumanist claims,
This seems to contradict the hypothesis that people's belief in the plausibility of immortality is linked to their own nearness/fear of death. Was there any correlations in the expected singularity date?
Relevant SMBC (Summary futurists predicted date of immortality discovery is slightly before the end of their expected lifespan)
2009:
- 45% libertarianism
- 38.4% liberalism
- 12.3% socialism
- 4.3% (6) conservativism
- "not one person willing to own up to being a commie."
2011:
- liberalism 34.5% (376)
- libertarianism 32.3% (352)
- socialism 26.6% at (290)
- conservatism 2.8% (30)
- communism 0.5% (5)
I generally expect LW to grow less metacontrarian on politics the larger it gets, so this change didn't surprise me. An alternative explanation (and now that I think of it more likley) is that the starting core group of LWers wasn't just more metacontrarian than usual, but probably also...
There were a few significant demographics differences here. Women tended to be more skeptical of the extreme transhumanist claims like cryonics and antiagathics (for example, men thought the current generation had a 24.7% chance of seeing someone live to 1000 years; women thought there was only a 9.2% chance). Older people were less likely to believe in transhumanist claims, a little less likely to believe in anthropogenic global warming, and more likely to believe in aliens living in our galaxy.
This bit is interesting. If our age and gender affects our...
You have that backwards. If you're young and male, you should suspect that part of your confidence in global warming and lack of aliens is due to your demographics, and therefore update away from global warming and toward aliens.
(9.9%) were atheist and spiritual
I thought you meant spiritual as in "Find something more important than you are and dedicate your life to it." did I misinterpret?
This made my trust in the community and my judgement of its average quality go down a LOT, and my estimate of my own value to the community, SIAI, and the world in general go up with a LOT.
Which parts, specifically?
(it didn't have an effect like that on me, I didn't see that many surprising things)
This made my trust in the community and my judgement of its average quality go down a LOT...
I expected almost everyone to agree with Eliezer on most important things...
Alicorn (top-poster) doesn't agree with Eliezer about ethics. PhilGoetz (top-poster) doesn't agree with Eliezer. Wei_Dai (top-poster) doesn't agree with Eliezer on AI issues. wedrifid (top-poster) doesn't agree with Eliezer on CEV and the interpretation of some game and decision theoretic thought experiments.
I am pretty sure Yvain doesn't agree with Eliezer on quite a few things too (too lazy to look it up now).
Generally there are a lot of top-notch people who don't agree with Eliezer. Robin Hanson for example. But also others who have read all of the Sequences, like Holden Karnofsky from GiveWell, John Baez or Katja Grace who has been a visiting fellow.
But even Rolf Nelson (a major donor and well-read Bayesian) disagrees about the Amanda Knox trial. Or take Peter Thiel (SI's top donor) who thinks that the Seasteading Institute deserves more money than the Singularity Institute.
I am extremely surprised by this, and very confused. This is strange because I technically knew each of those individual examples... I'm not sure what's going on, but I'm sure that whatever it is it's my fault and extremely unflattering to my ability as a rationalist.
How am I supposed to follow my consensus-trusting heuristics when no consensus exists? I'm to lazy to form my own opinions! :p
Holden Karnofsky has read all of the Sequences?
I wrote him an email to make sure. Here is his reply:
I've read a lot of the sequences. Probably the bulk of them. Possibly all of them. I've also looked pretty actively for SIAI-related content directly addressing the concerns I've outlined (including speaking to different people connected with SIAI).
I expected almost everyone to agree with Eliezer on most important things
That would have made my trust in the community go down a lot. Echo chambers rarely produce good results.
You may think you encounter a lot of contrarians on LW, but I disagree - we're all sheep.
But seriously, look at that MWI poll result. How many LWers have ever seriously looked at all the competing theories, or could even name many alternatives? ('Collapse, MWI, uh...' - much less could discuss why they dislike pilot waves or whatever.) I doubt many fewer could do so than plumped for MWI - because Eliezer is such a fan...
I disagree. I updated significantly in favour of MWI just because the QM sequence helped me introspect and perceive that much of my prior prejudice against MWI were irrational biases such as "I don't think I would like it if MWI was true. Plus I find it a worn-out trope in science fiction. Also it feels like we live in a single world." or misapplications of rational ideas like "Wouldn't Occam's razor favor a single world?"
I still don't know much of the mathematics underpinning QM. I updated in favour of MWI simply by demolishing faulty arguments I had against it.
Could you make a copy of the survey (with the exact wordings of all the questions) available for download?
It would be neat if you posted a link to a downloadable spreadsheet like last time. I'd like to look at the data, if I happened to miss it via careless reading, sorry for bothering you.
Edit: Considering this is downovted I guess I must have missed it. I skimmed the post again and I'm just not seeing it, can someone please help with a link? :)
2nd Edit: Sorry missed it the first time!
God (a supernatural creator of the universe) exists: 5.64, (0, 0, 1) Some revealed religion is true: 3.40, (0, 0, .15)
This result is, not exactly surprising to me, but odd by my reading of the questions. It may seem at first glance like a conjunction fallacy to rate the second question's probability much higher than the first (which I did). But in fact, the god question, like the supernatural question referred to a very specific thing "ontologically basic mental entities", while the "some revealed religion is more or less true" que...
The other 72.3% of people who had to find Less Wrong the hard way.
Is it just me or is there something not quite right about this, as an English sentence.
For the next survey:
160 people wanted their responses kept private. They have been removed. The rest have been sorted by age to remove any information about the time they took the survey. I've converted what's left to a .xls file, and you can download it here.
Karma is sufficient to identify a lot of people. You could give ranges instead (making sure there are enough people in each range).
Of possible existential risks, the most feared was a bioengineered pandemic, which got 194 votes (17.8%) - a natural pandemic got 89 (8.2%), making pandemics the overwhelming leader.
This doesn't look very good from the point of view of the Singularity Institute. While 38.5% of all people have read at least 75% of the Sequences only 16.5% think that unfriendly AI is the most worrisome existential risk.
Is the issue too hard to grasp for most people or has it so far been badly communicated by the Singularity Institute? Or is it simply the wisdom of crowds?
The irony of this is that if, say, 83.5% of respondents instead thought UFAI was the most worrisome existential risk, that would likely be taken as evidence that the LW community was succumbing to groupthink.
801 people (73.5%) were atheist and not spiritual, 108 (9.9%) were atheist and spiritual
I'm curious as to how people interpreted this. Does the latter mean that one believes in the supernatural but without a god figure, e.g. buddism, new age? This question looked confusing to me at first glance.
People who believed in high existential risk were more likely to believe in global warming, more likely to believe they had a higher IQ than average, and more likely to believe in aliens (I found that same result last time, and it puzzled me then too.)
Why does it puzzle you?
I'd be interested in knowing what percentage of LWers attended a private high school [or equivalent in country of origin].
so this supports taking them as a direct line to prevailing rationalist opinion rather than the contingent opinions of one random group.
http://lesswrong.com/lw/82s/dont_call_yourself_a_rationalist/
I have no idea if this is universal. (Probably not.) However, in my area, using the term "blacks" in certain social circles is not considered proper vocabulary.
I don't have any huge problem with using the term. However, using it may be bad signalling and leaves Lesswrong vulnerable to pattern-matching.
What would you prefer? "Blacks" is the way I've seen it used in medical and psychological journal articles.
The plural can look weird but as long as it doesn't come after a definite article, it's the standard term and I've never met anyone who was offended by it. The usual politically correct substitute, African-American, is offensive in an international context.
Moreover, there are plenty of black people in the world who are not African-American.
There's an infamous video from a few years back in which an American interviewer makes this mistake when talking to an Olympic athlete of British nationality and African ancestry. It becomes increasingly clear that the interviewer is merely doing a mental substitution of "African-American" for "black" without actually thinking about what the former term means ...
I even feel weird calling Obama an African-American (though I still do it, because he self-identifies as one). In my mental lexicon it usually specifically refers to descendants of the African slaves taken to the Americas a long time ago, whereas Obama's parents are a White American of English ancestry and a Kenyan who hadn't been to the US until college.
Ironically, Obama is exactly the kind of person to whom that term should refer, if it means anything at all. Descendants of African slaves taken to the Americas a long time ago should have another term, such as "American blacks".
Despite his lack of membership in it, Obama self-identifies with the latter group for obvious political reasons; after all, "children of foreign exchange students" is not an important constituency.
A big thank you to the 1090 people who took the second Less Wrong Census/Survey.
Does this mean there are 1090 people who post on Less Wrong? Not necessarily. 165 people said they had zero karma, and 406 people skipped the karma question - I assume a good number of the skippers were people with zero karma or without accounts. So we can only prove that 519 people post on Less Wrong. Which is still a lot of people.
I apologize for failing to ask who had or did not have an LW account. Because there are a number of these failures, I'm putting them all in a comment to this post so they don't clutter the survey results. Please talk about changes you want for next year's survey there.
Of our 1090 respondents, 972 (89%) were male, 92 (8.4%) female, 7 (.6%) transexual, and 19 gave various other answers or objected to the question. As abysmally male-dominated as these results are, the percent of women has tripled since the last survey in mid-2009.
We're also a little more diverse than we were in 2009; our percent non-whites has risen from 6% to just below 10%. Along with 944 whites (86%) we include 38 Hispanics (3.5%), 31 East Asians (2.8%), 26 Indian Asians (2.4%) and 4 blacks (.4%).
Age ranged from a supposed minimum of 1 (they start making rationalists early these days?) to a more plausible minimum of 14, to a maximum of 77. The mean age was 27.18 years. Quartiles (25%, 50%, 75%) were 21, 25, and 30. 90% of us are under 38, 95% of us are under 45, but there are still eleven Less Wrongers over the age of 60. The average Less Wronger has aged about one week since spring 2009 - so clearly all those anti-agathics we're taking are working!
In order of frequency, we include 366 computer scientists (32.6%), 174 people in the hard sciences (16%) 80 people in finance (7.3%), 63 people in the social sciences (5.8%), 43 people involved in AI (3.9%), 39 philosophers (3.6%), 15 mathematicians (1.5%), 14 statisticians (1.3%), 15 people involved in law (1.5%) and 5 people in medicine (.5%).
48 of us (4.4%) teach in academia, 470 (43.1%) are students, 417 (38.3%) do for-profit work, 34 (3.1%) do non-profit work, 41 (3.8%) work for the government, and 72 (6.6%) are unemployed.
418 people (38.3%) have yet to receive any degrees, 400 (36.7%) have a Bachelor's or equivalent, 175 (16.1%) have a Master's or equivalent, 65 people (6%) have a Ph.D, and 19 people (1.7%) have a professional degree such as an MD or JD.
345 people (31.7%) are single and looking, 250 (22.9%) are single but not looking, 286 (26.2%) are in a relationship, and 201 (18.4%) are married. There are striking differences across men and women: women are more likely to be in a relationship and less likely to be single and looking (33% men vs. 19% women). All of these numbers look a lot like the ones from 2009.
27 people (2.5%) are asexual, 119 (10.9%) are bisexual, 24 (2.2%) are homosexual, and 902 (82.8%) are heterosexual.
625 people (57.3%) described themselves as monogamous, 145 (13.3%) as polyamorous, and 298 (27.3%) didn't really know. These numbers were similar between men and women.
The most popular political view, at least according to the much-maligned categories on the survey, was liberalism, with 376 adherents and 34.5% of the vote. Libertarianism followed at 352 (32.3%), then socialism at 290 (26.6%), conservativism at 30 (2.8%) and communism at 5 (.5%).
680 people (62.4%) were consequentialist, 152 (13.9%) virtue ethicist, 49 (4.5%) deontologist, and 145 (13.3%) did not believe in morality.
801 people (73.5%) were atheist and not spiritual, 108 (9.9%) were atheist and spiritual, 97 (8.9%) were agnostic, 30 (2.8%) were deist or pantheist or something along those lines, and 39 people (3.5%) described themselves as theists (20 committed plus 19 lukewarm)
425 people (38.1%) grew up in some flavor of nontheist family, compared to 297 (27.2%) in committed theist families and 356 in lukewarm theist families (32.7%). Common family religious backgrounds included Protestantism with 451 people (41.4%), Catholicism with 289 (26.5%) Jews with 102 (9.4%), Hindus with 20 (1.8%), Mormons with 17 (1.6%) and traditional Chinese religion with 13 (1.2%)
There was much derision on the last survey over the average IQ supposedly being 146. Clearly Less Wrong has been dumbed down since then, since the average IQ has fallen all the way down to 140. Numbers ranged from 110 all the way up to 204 (for reference, Marilyn vos Savant, who holds the Guinness World Record for highest adult IQ ever recorded, has an IQ of 185).
89 people (8.2%) have never looked at the Sequences; a further 234 (32.5%) have only given them a quick glance. 170 people have read about 25% of the sequences, 169 (15.5%) about 50%, 167 (15.3%) about 75%, and 253 people (23.2%) said they've read almost all of them. This last number is actually lower than the 302 people who have been here since the Overcoming Bias days when the Sequences were still being written (27.7% of us).
The other 72.3% of people who had to find Less Wrong the hard way. 121 people (11.1%) were referred by a friend, 259 people (23.8%) were referred by blogs, 196 people (18%) were referred by Harry Potter and the Methods of Rationality, 96 people (8.8%) were referred by a search engine, and only one person (.1%) was referred by a class in school.
Of the 259 people referred by blogs, 134 told me which blog referred them. There was a very long tail here, with most blogs only referring one or two people, but the overwhelming winner was Common Sense Atheism, which is responsible for 18 current Less Wrong readers. Other important blogs and sites include Hacker News (11 people), Marginal Revolution (6 people), TV Tropes (5 people), and a three way tie for fifth between Reddit, SebastianMarshall.com, and You Are Not So Smart (3 people).
Of those people who chose to list their karma, the mean value was 658 and the median was 40 (these numbers are pretty meaningless, because some people with zero karma put that down and other people did not).
Of those people willing to admit the time they spent on Less Wrong, after eliminating one outlier (sorry, but you don't spend 40579 minutes daily on LW; even I don't spend that long) the mean was 21 minutes and the median was 15 minutes. There were at least a dozen people in the two to three hour range, and the winner (well, except the 40579 guy) was someone who says he spends five hours a day.
I'm going to give all the probabilities in the form [mean, (25%-quartile, 50%-quartile/median, 75%-quartile)]. There may have been some problems here revolving around people who gave numbers like .01: I didn't know whether they meant 1% or .01%. Excel helpfully rounded all numbers down to two decimal places for me, and after a while I decided not to make it stop: unless I wanted to do geometric means, I can't do justice to really small grades in probability.
The Many Worlds hypothesis is true: 56.5, (30, 65, 80)
There is intelligent life elsewhere in the Universe: 69.4, (50, 90, 99)
There is intelligent life elsewhere in our galaxy: 41.2, (1, 30, 80)
The supernatural (ontologically basic mental entities) exists: 5.38, (0, 0, 1)
God (a supernatural creator of the universe) exists: 5.64, (0, 0, 1)
Some revealed religion is true: 3.40, (0, 0, .15)
Average person cryonically frozen today will be successfully revived: 21.1, (1, 10, 30)
Someone now living will reach age 1000: 23.6, (1, 10, 30)
We are living in a simulation: 19, (.23, 5, 33)
Significant anthropogenic global warming is occurring: 70.7, (55, 85, 95)
Humanity will make it to 2100 without a catastrophe killing >90% of us: 67.6, (50, 80, 90)
There were a few significant demographics differences here. Women tended to be more skeptical of the extreme transhumanist claims like cryonics and antiagathics (for example, men thought the current generation had a 24.7% chance of seeing someone live to 1000 years; women thought there was only a 9.2% chance). Older people were less likely to believe in transhumanist claims, a little less likely to believe in anthropogenic global warming, and more likely to believe in aliens living in our galaxy. Community veterans were more likely to believe in Many Worlds, less likely to believe in God, and - surprisingly - less likely to believe in cryonics (significant at 5% level; could be a fluke). People who believed in high existential risk were more likely to believe in global warming, more likely to believe they had a higher IQ than average, and more likely to believe in aliens (I found that same result last time, and it puzzled me then too.)
Intriguingly, even though the sample size increased by more than 6 times, most of these results are within one to two percent of the numbers on the 2009 survey, so this supports taking them as a direct line to prevailing rationalist opinion rather than the contingent opinions of one random group.
Of possible existential risks, the most feared was a bioengineered pandemic, which got 194 votes (17.8%) - a natural pandemic got 89 (8.2%), making pandemics the overwhelming leader. Unfriendly AI followed with 180 votes (16.5%), then nuclear war with 151 (13.9%), ecological collapse with 145 votes (12.3%), economic/political collapse with 134 votes (12.3%), and asteroids and nanotech bringing up the rear with 46 votes each (4.2%).
The mean for the Singularity question is useless because of the very high numbers some people put in, but the median was 2080 (quartiles 2050, 2080, 2150). The Singularity has gotten later since 2009: the median guess then was 2067. There was some discussion about whether people might have been anchored by the previous mention of 2100 in the x-risk question. I changed the order after 104 responses to prevent this; a t-test found no significant difference between the responses before and after the change (in fact, the trend was in the wrong direction).
Only 49 people (4.5%) have never considered cryonics or don't know what it is. 388 (35.6%) of the remainder reject it, 583 (53.5%) are considering it, and 47 (4.3%) are already signed up for it. That's more than double the percent signed up in 2009.
231 people (23.4% of respondents) have attended a Less Wrong meetup.
The average person was 37.6% sure their IQ would be above average - underconfident! Imagine that! (quartiles were 10, 40, 60). The mean was 54.5% for people whose IQs really were above average, and 29.7% for people whose IQs really were below average. There was a correlation of .479 (significant at less than 1% level) between IQ and confidence in high IQ.
Isaac Newton published his Principia Mathematica in 1687. Although people guessed dates as early as 1250 and as late as 1960, the mean was...1687 (quartiles were 1650, 1680, 1720). This marks the second consecutive year that the average answer to these difficult historical questions has been exactly right (to be fair, last time it was the median that was exactly right and the mean was all of eight months off). Let no one ever say that the wisdom of crowds is not a powerful tool.
The average person was 34.3% confident in their answer, but 41.9% of people got the question right (again with the underconfidence!). There was a highly significant correlation of r = -.24 between confidence and number of years error.
This graph may take some work to read. The x-axis is confidence. The y-axis is what percent of people were correct at that confidence level. The red line you recognize as perfect calibration. The thick green line is your results from the Newton problem. The black line is results from the general population I got from a different calibration experiment tested on 50 random trivia questions; take the intercomparability of the two with a grain of salt.
As you can see, Less Wrong does significantly better than the general population. However, there are a few areas of failure. First is that, as usual, people who put zero and one hundred percent had nonzero chances of getting the question right or wrong: 16.7% of people who put "0" were right, and 28.6% of people who put "100" were wrong (interestingly, people who put 100 did worse than the average of everyone else in the 90-99 bracket, of whom only 12.2% erred). Second of all, the line is pretty horizontal from zero to fifty or so. People who thought they had a >50% chance of being right had excellent calibration, but people who gave themselves a low chance of being right were poorly calibrated. In particular, I was surprised to see so many people put numbers like "0". If you're pretty sure Newton lived after the birth of Christ, but before the present day, that alone gives you a 1% chance of randomly picking the correct 20-year interval.
160 people wanted their responses kept private. They have been removed. The rest have been sorted by age to remove any information about the time they took the survey. I've converted what's left to a .xls file, and you can download it here.